Week 1 exploratory data analysis
Description of the data
There are 1087140 rows, and each row represents one trial. We have the following columns:
- choice (right 53%, left 46%, violation of forced choice 1%)
- reward (0 or 1, mean 0.572214, std 0.494758)
- session number (1946 sessions total)
- trial type (free choice 90%, left only 5%, right only 5%)
- reaction time (mean 0.515855, std 7.778415)
- trial number (1087140 trials total)
- rat number (there are 20 total)
The number of trials per rat ranges from 12324 to 237974.
How the data is organized
Data for each rat is all together in the data – i.e. there is no gap in trial numbers for a rat:
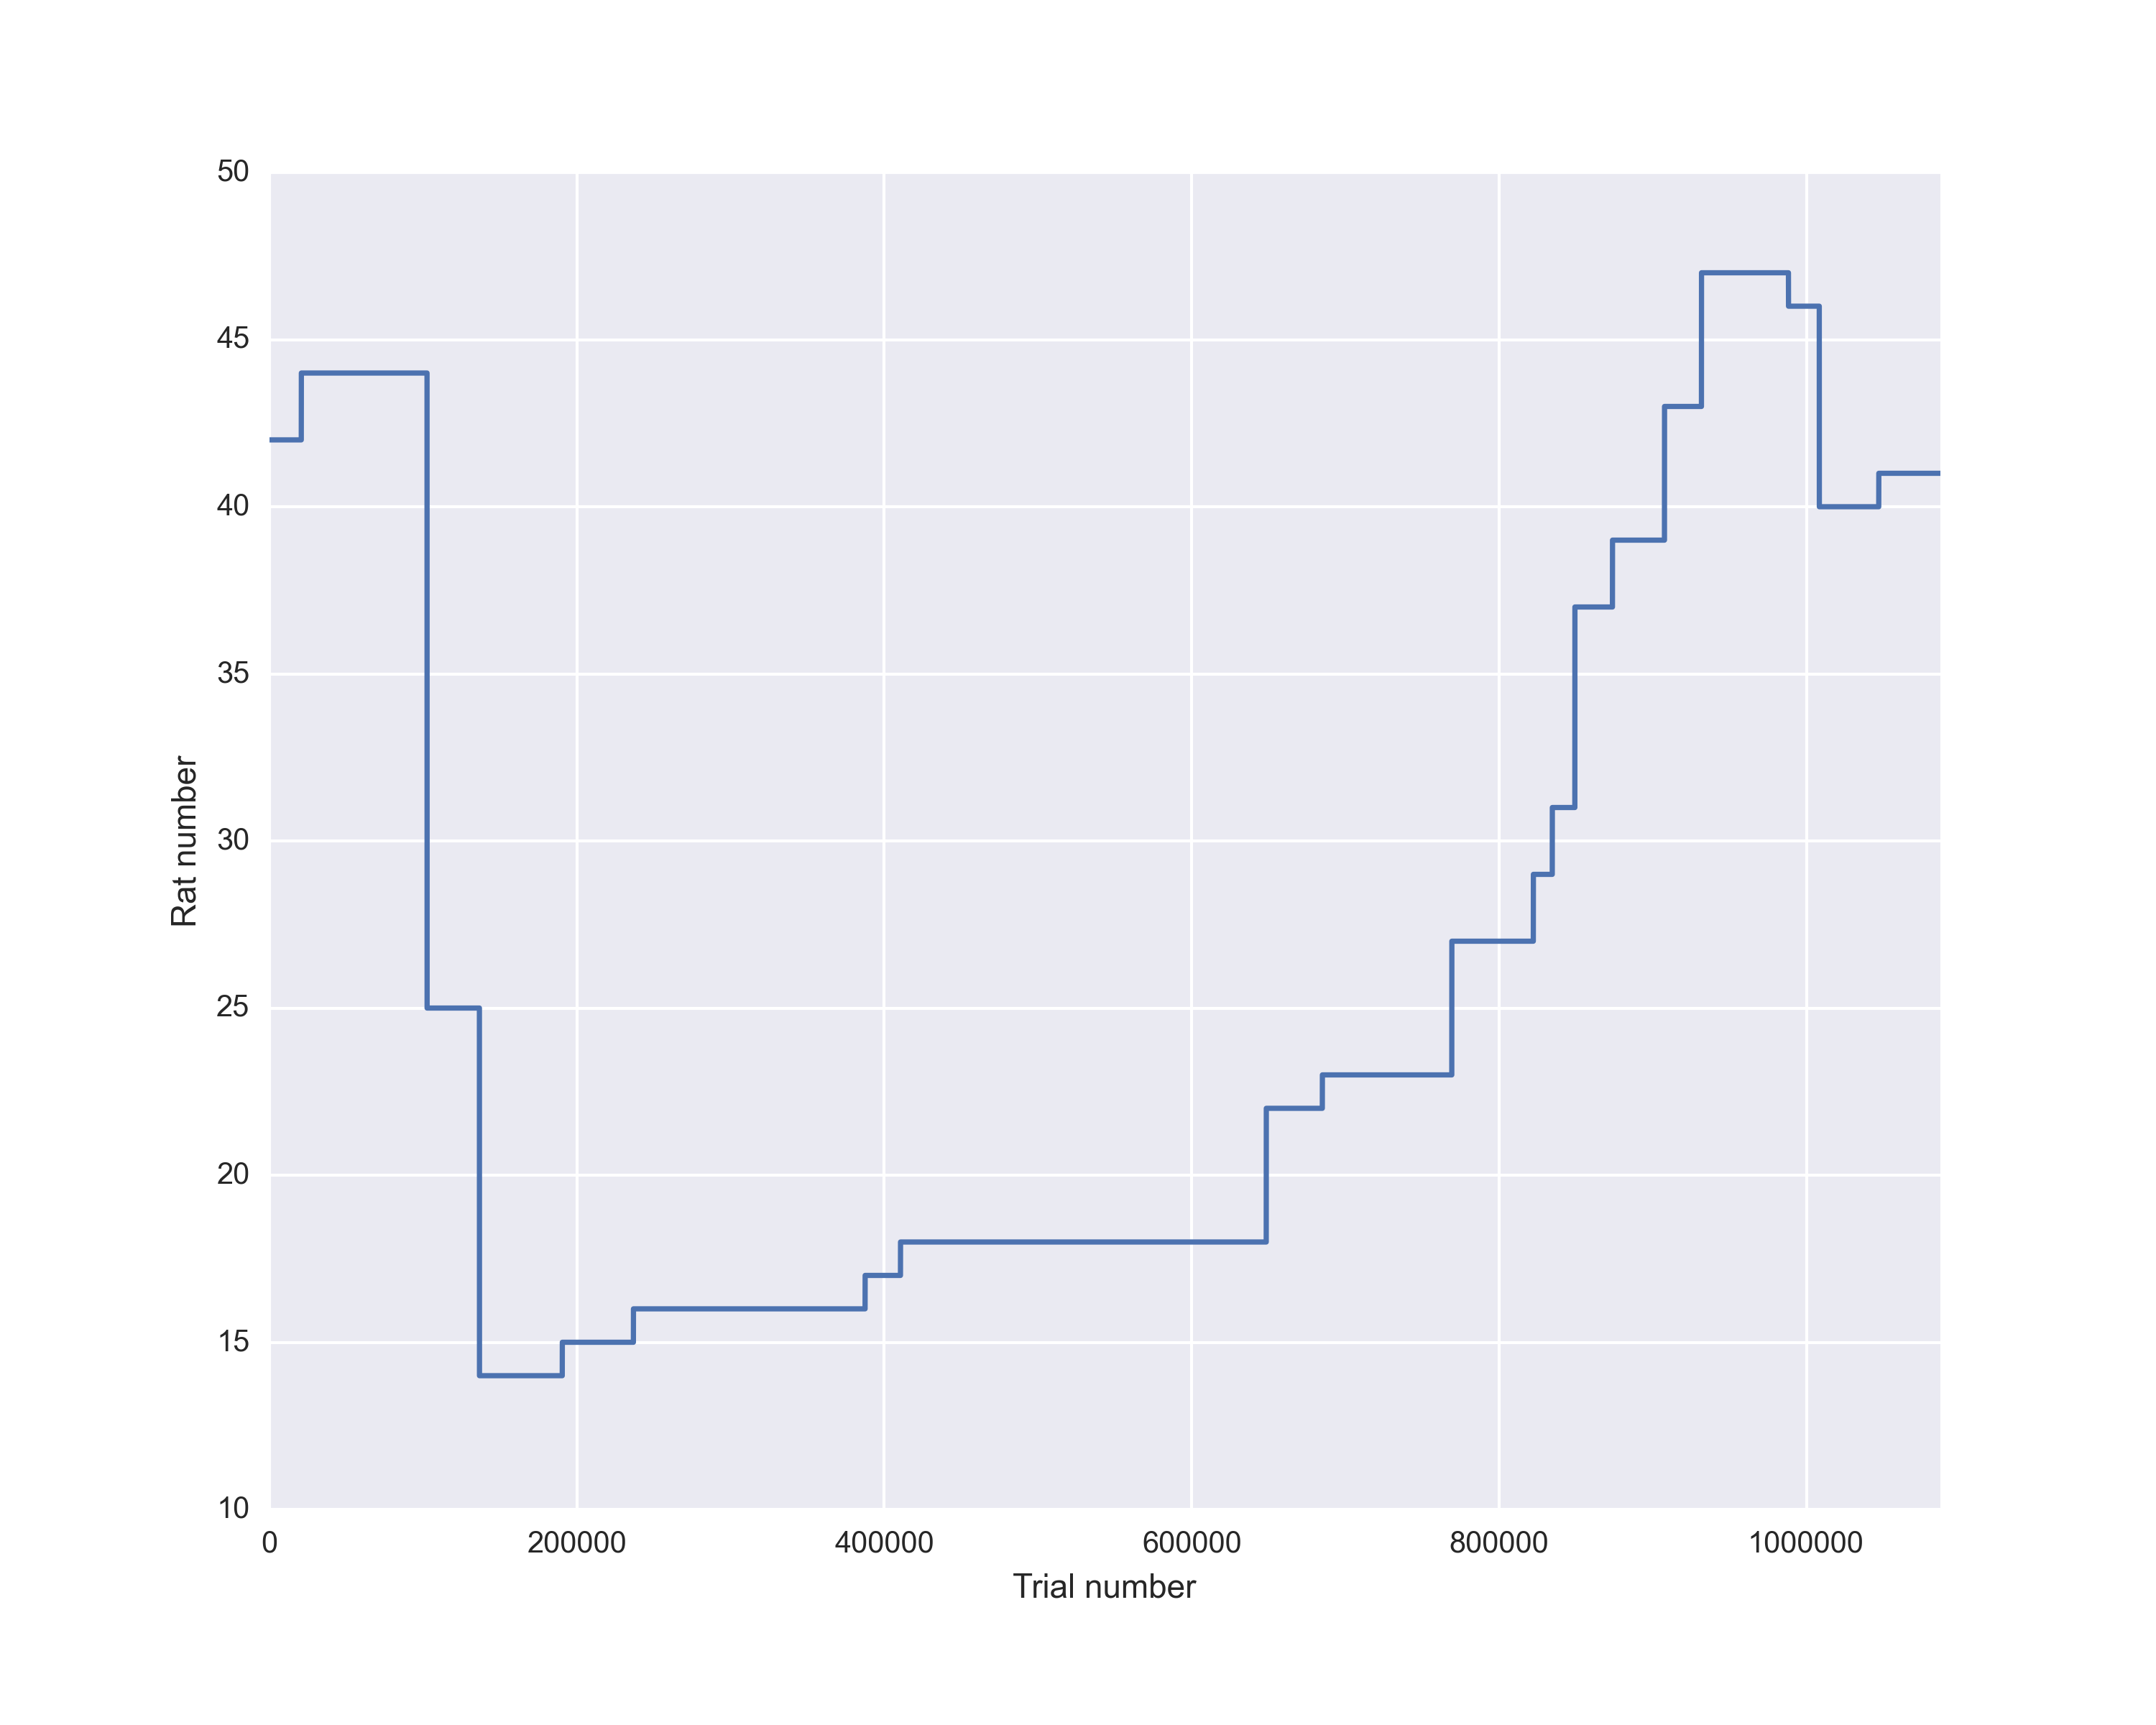
Trial numbers are continuous for each rat:
Rat 42 : min  0  max  20677
Rat 44 : min  20678  max  102494
Rat 25 : min  102495  max  136573
Rat 14 : min  136574  max  190471
Rat 15 : min  190472  max  236763
Rat 16 : min  236764  max  387498
Rat 17 : min  387499  max  410524
Rat 18 : min  410525  max  648498
Rat 22 : min  648499  max  684993
Rat 23 : min  684994  max  769229
Rat 27 : min  769230  max  822278
Rat 29 : min  822279  max  834602
Rat 31 : min  834603  max  849296
Rat 37 : min  849297  max  873762
Rat 39 : min  873763  max  907607
Rat 43 : min  907608  max  931664
Rat 47 : min  931665  max  988275
Rat 46 : min  988276  max  1008326
Rat 40 : min  1008327  max  1047021
Rat 41 : min  1047022  max  1087139
How long are sessions?
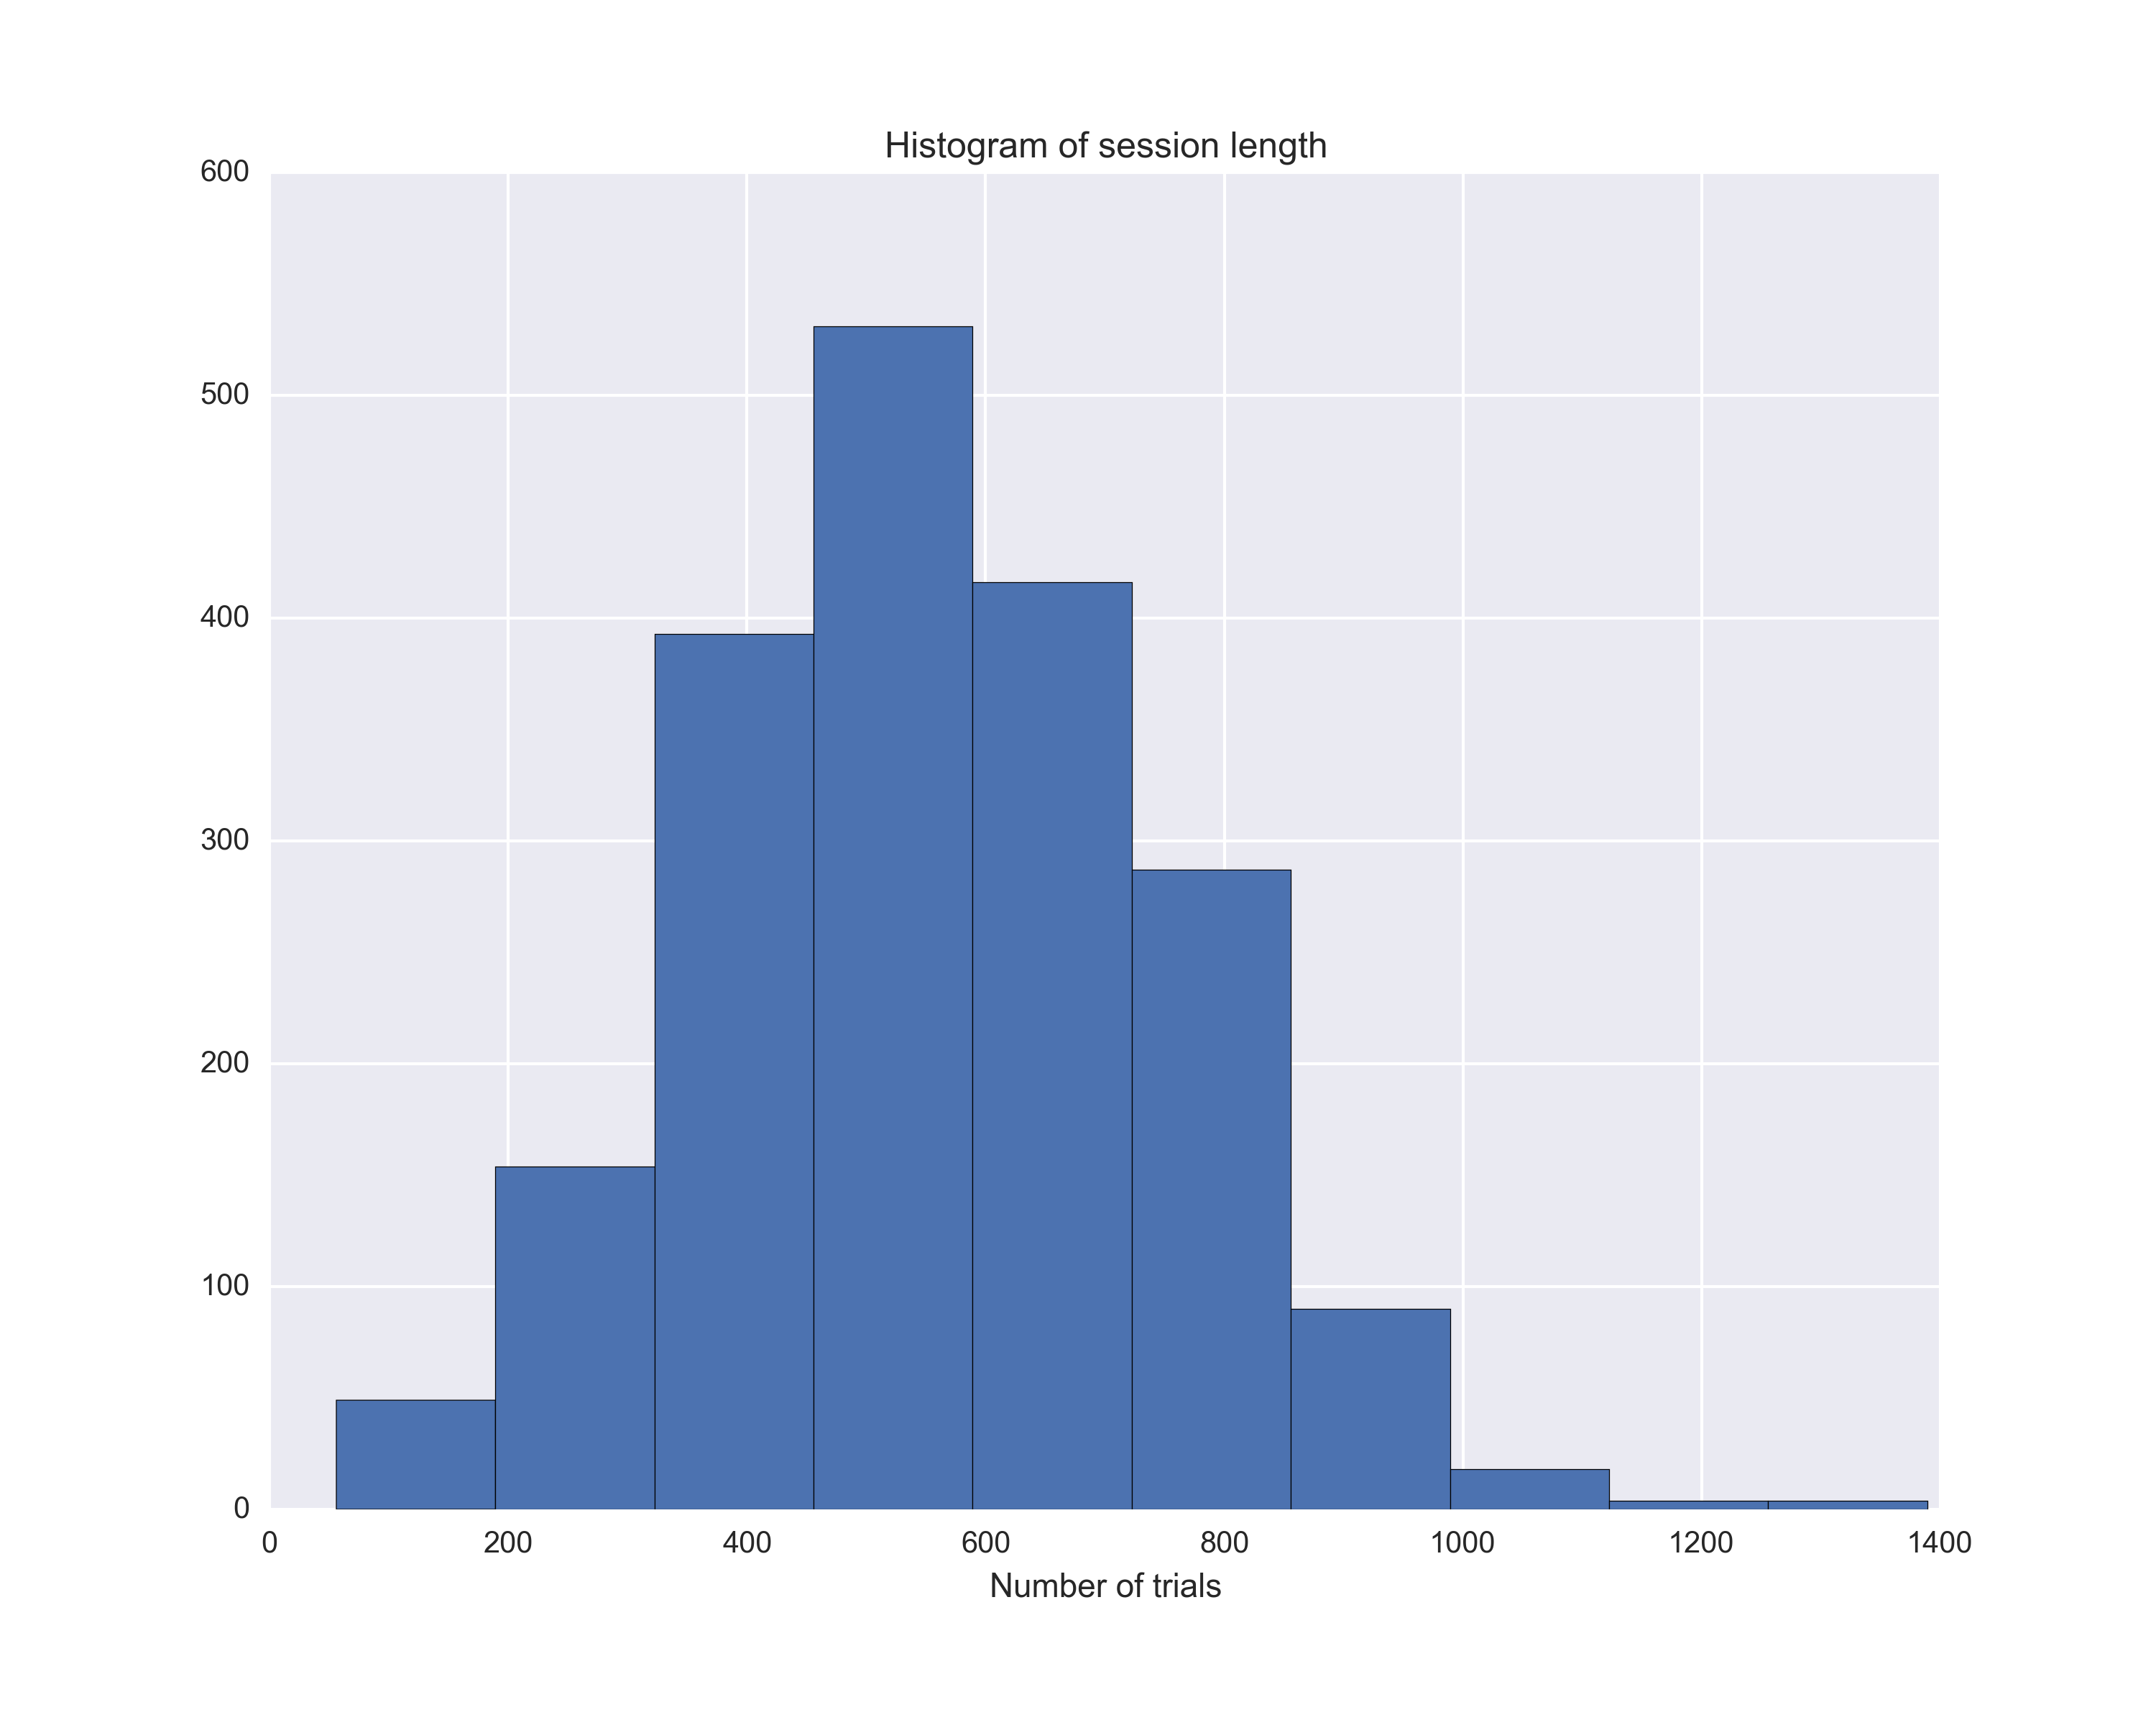
The mean session size is 558.653649, with std 192.371081. Session size ranges from 56 to 1389.
Here is a histogram of session size:
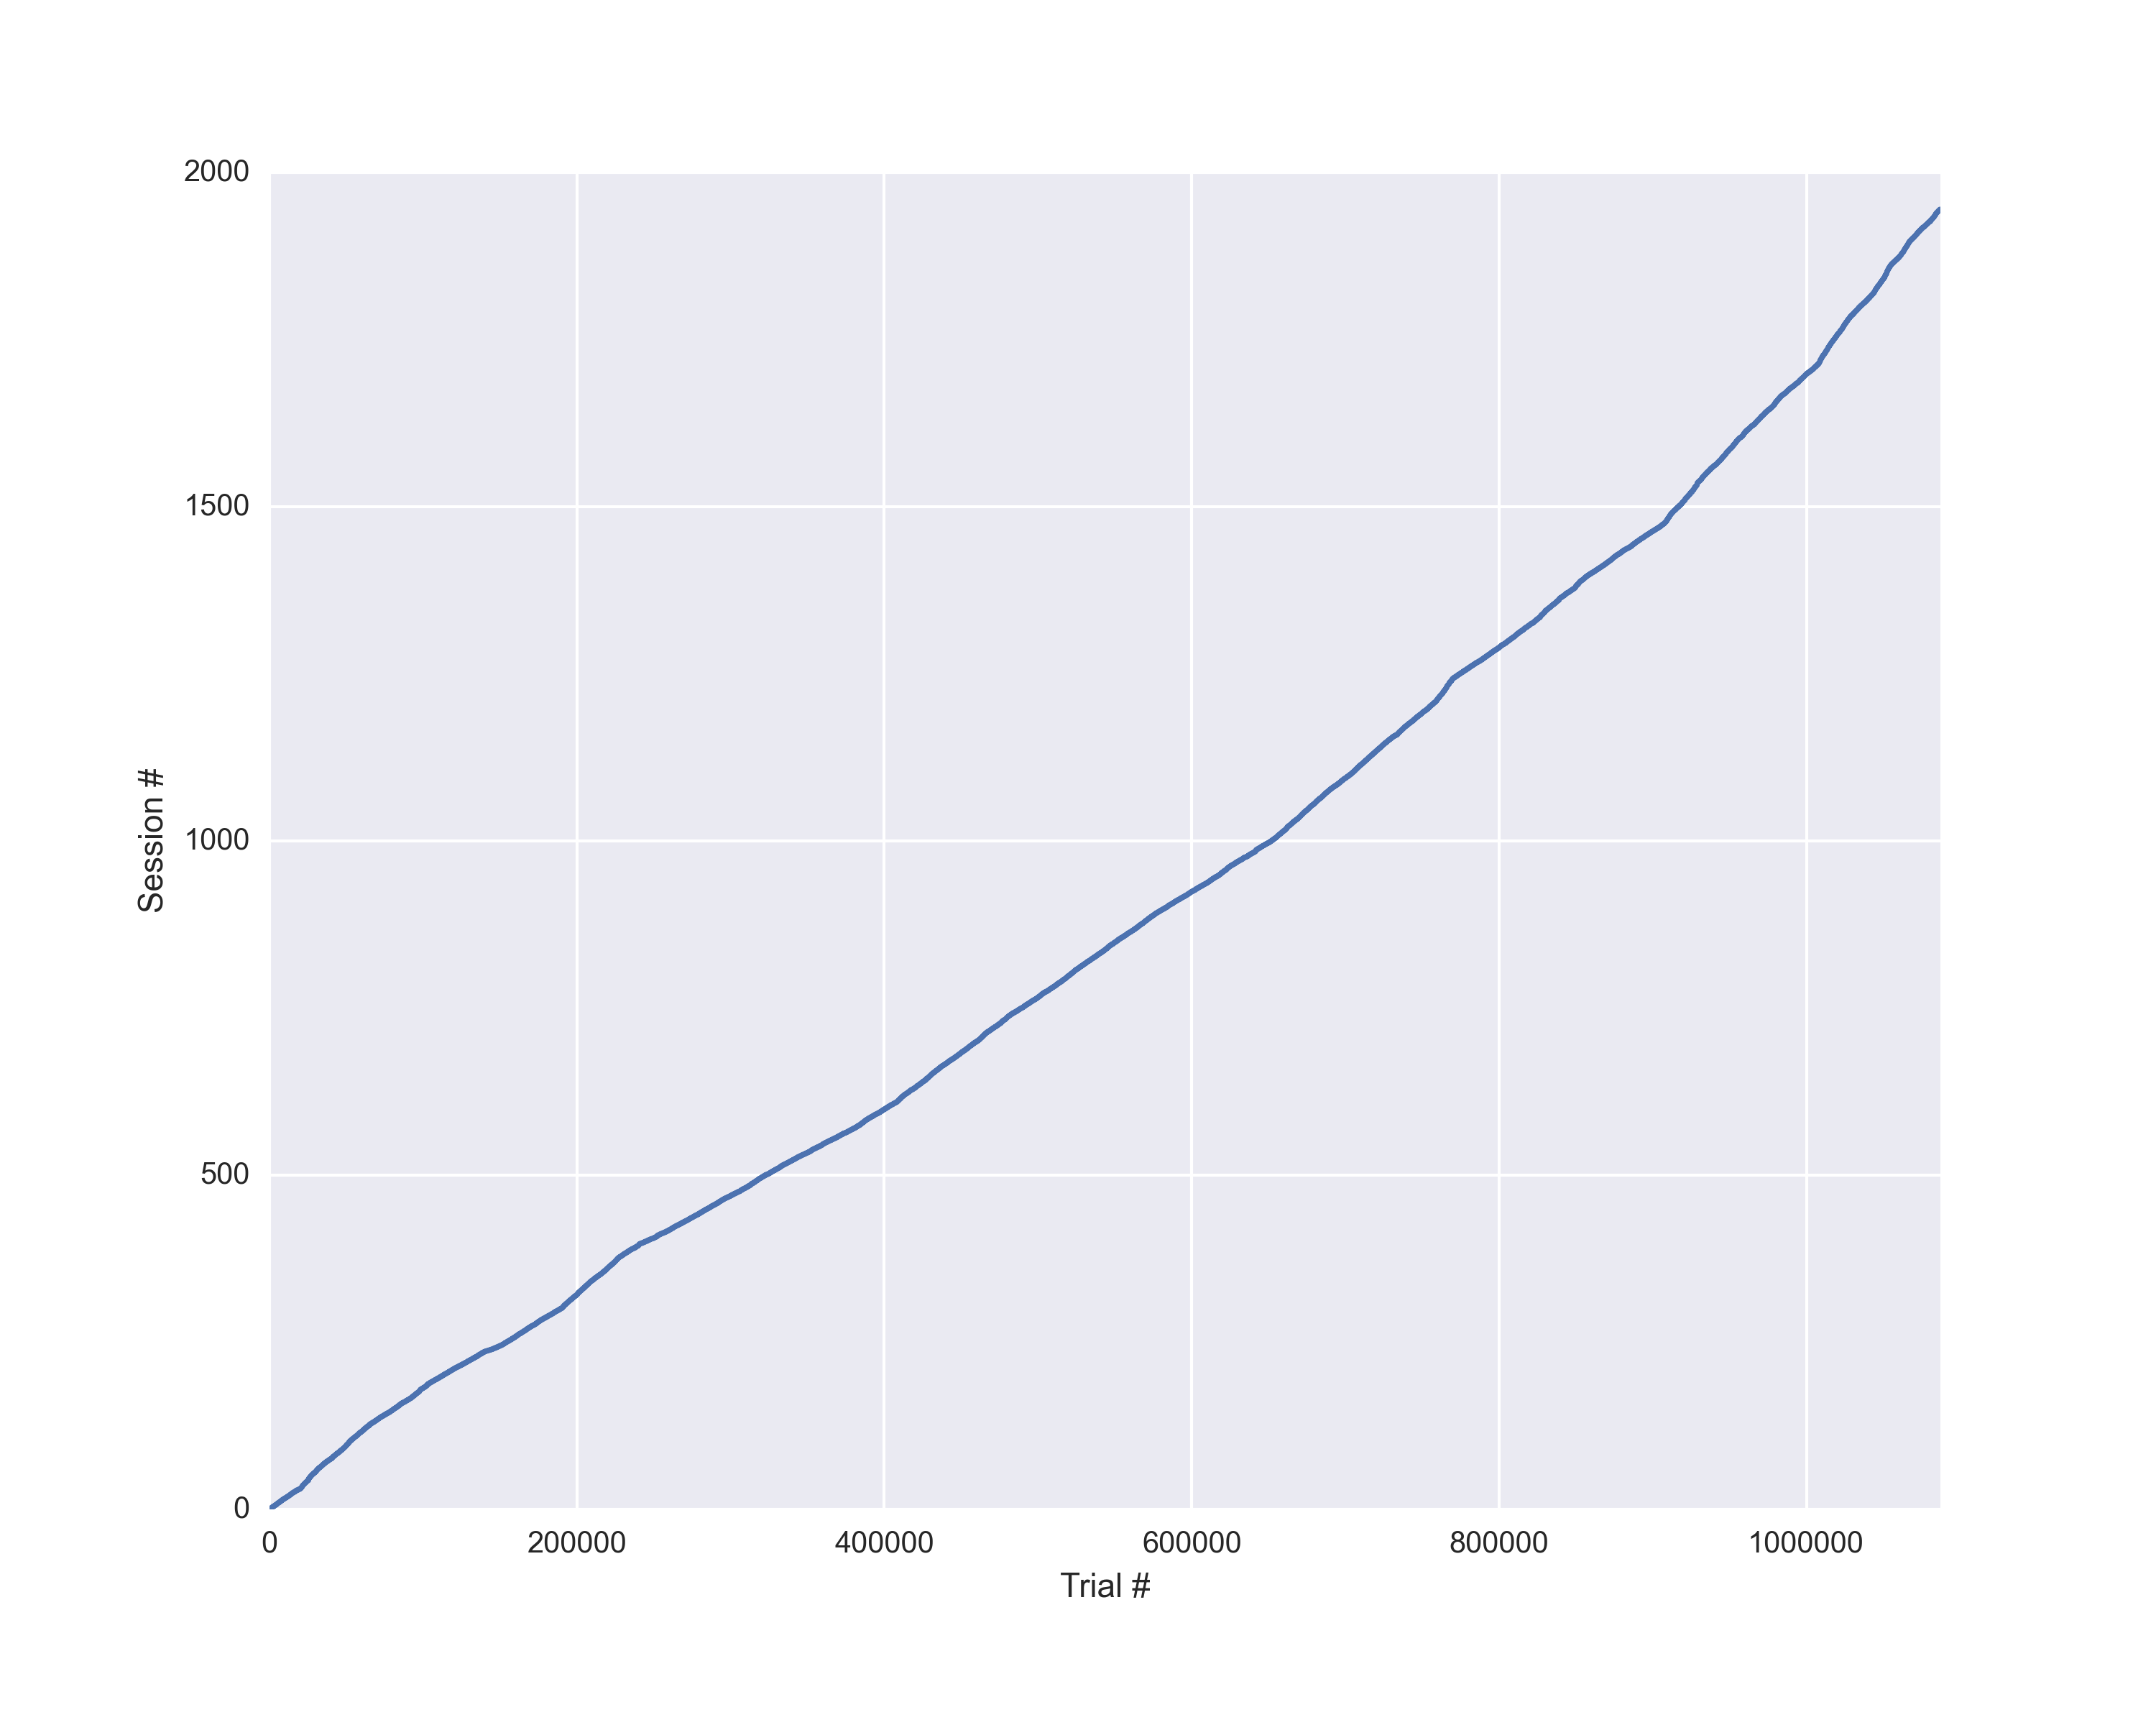
Here is how session number increments over trials:
When are rewards given within a session?
Here is the reward distribution in relation to how many trials we are into the session, for one session:
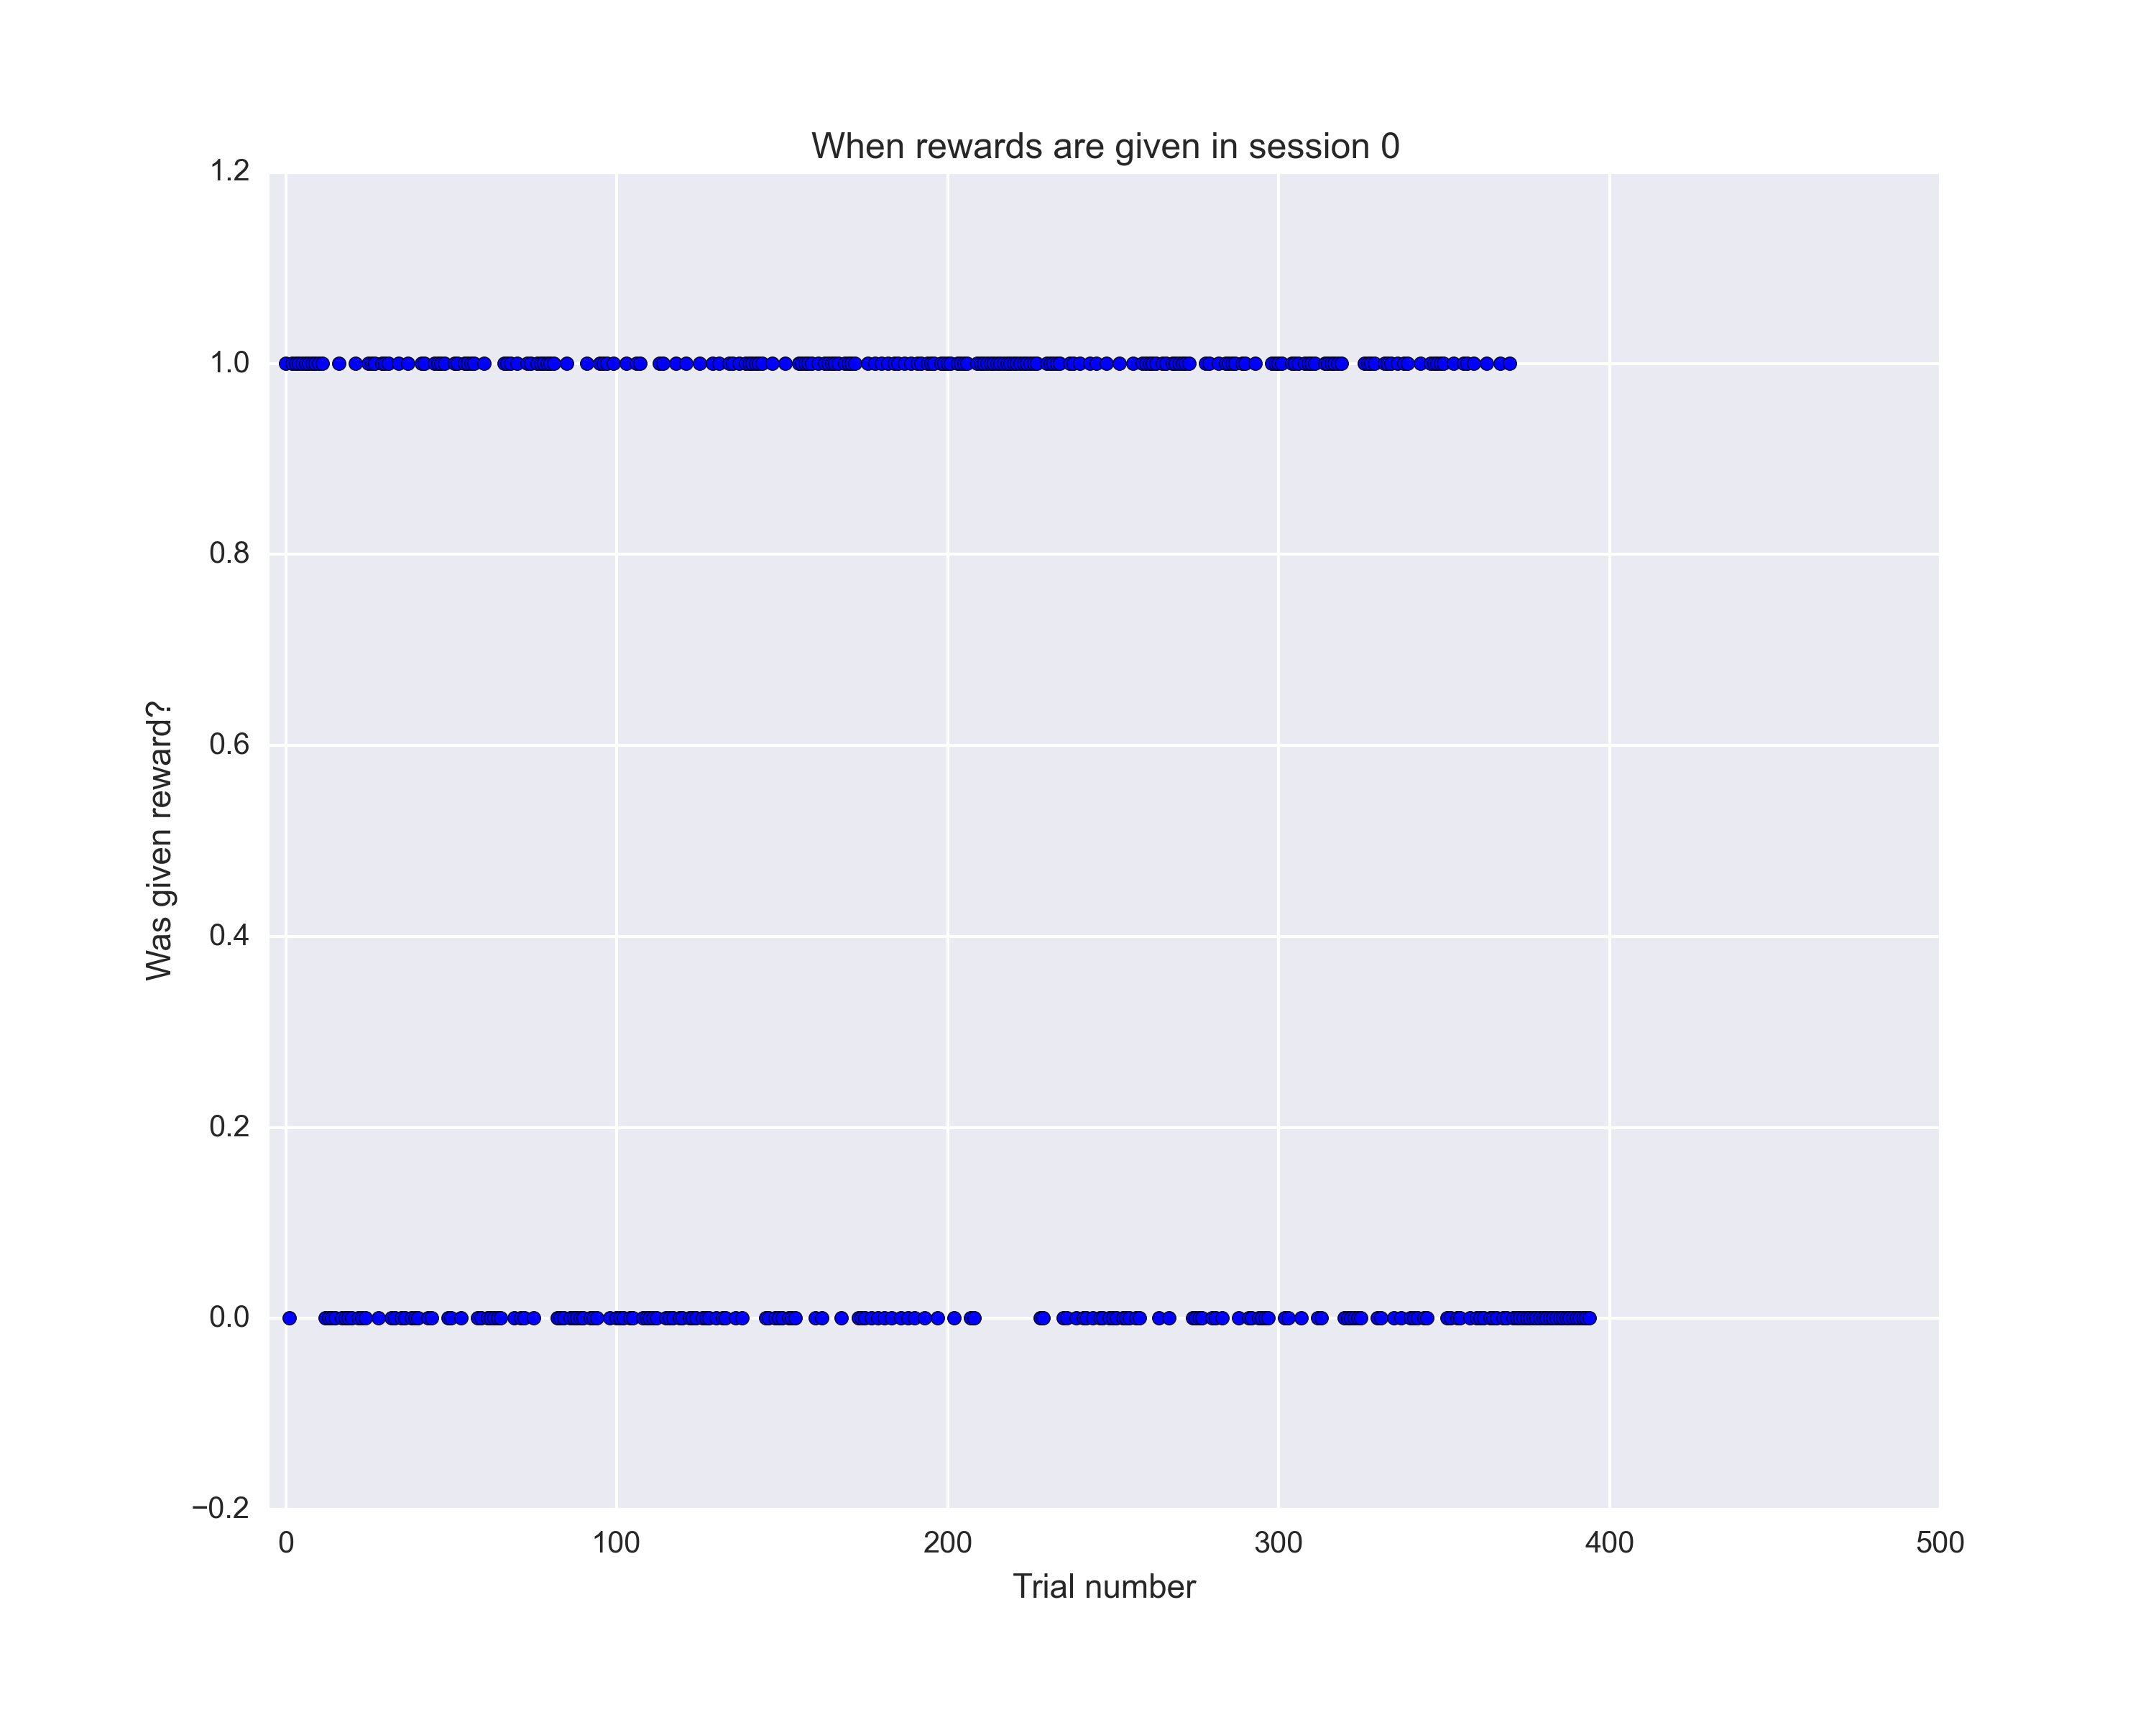
Clearly, rewards are given very often and all throughout the session.
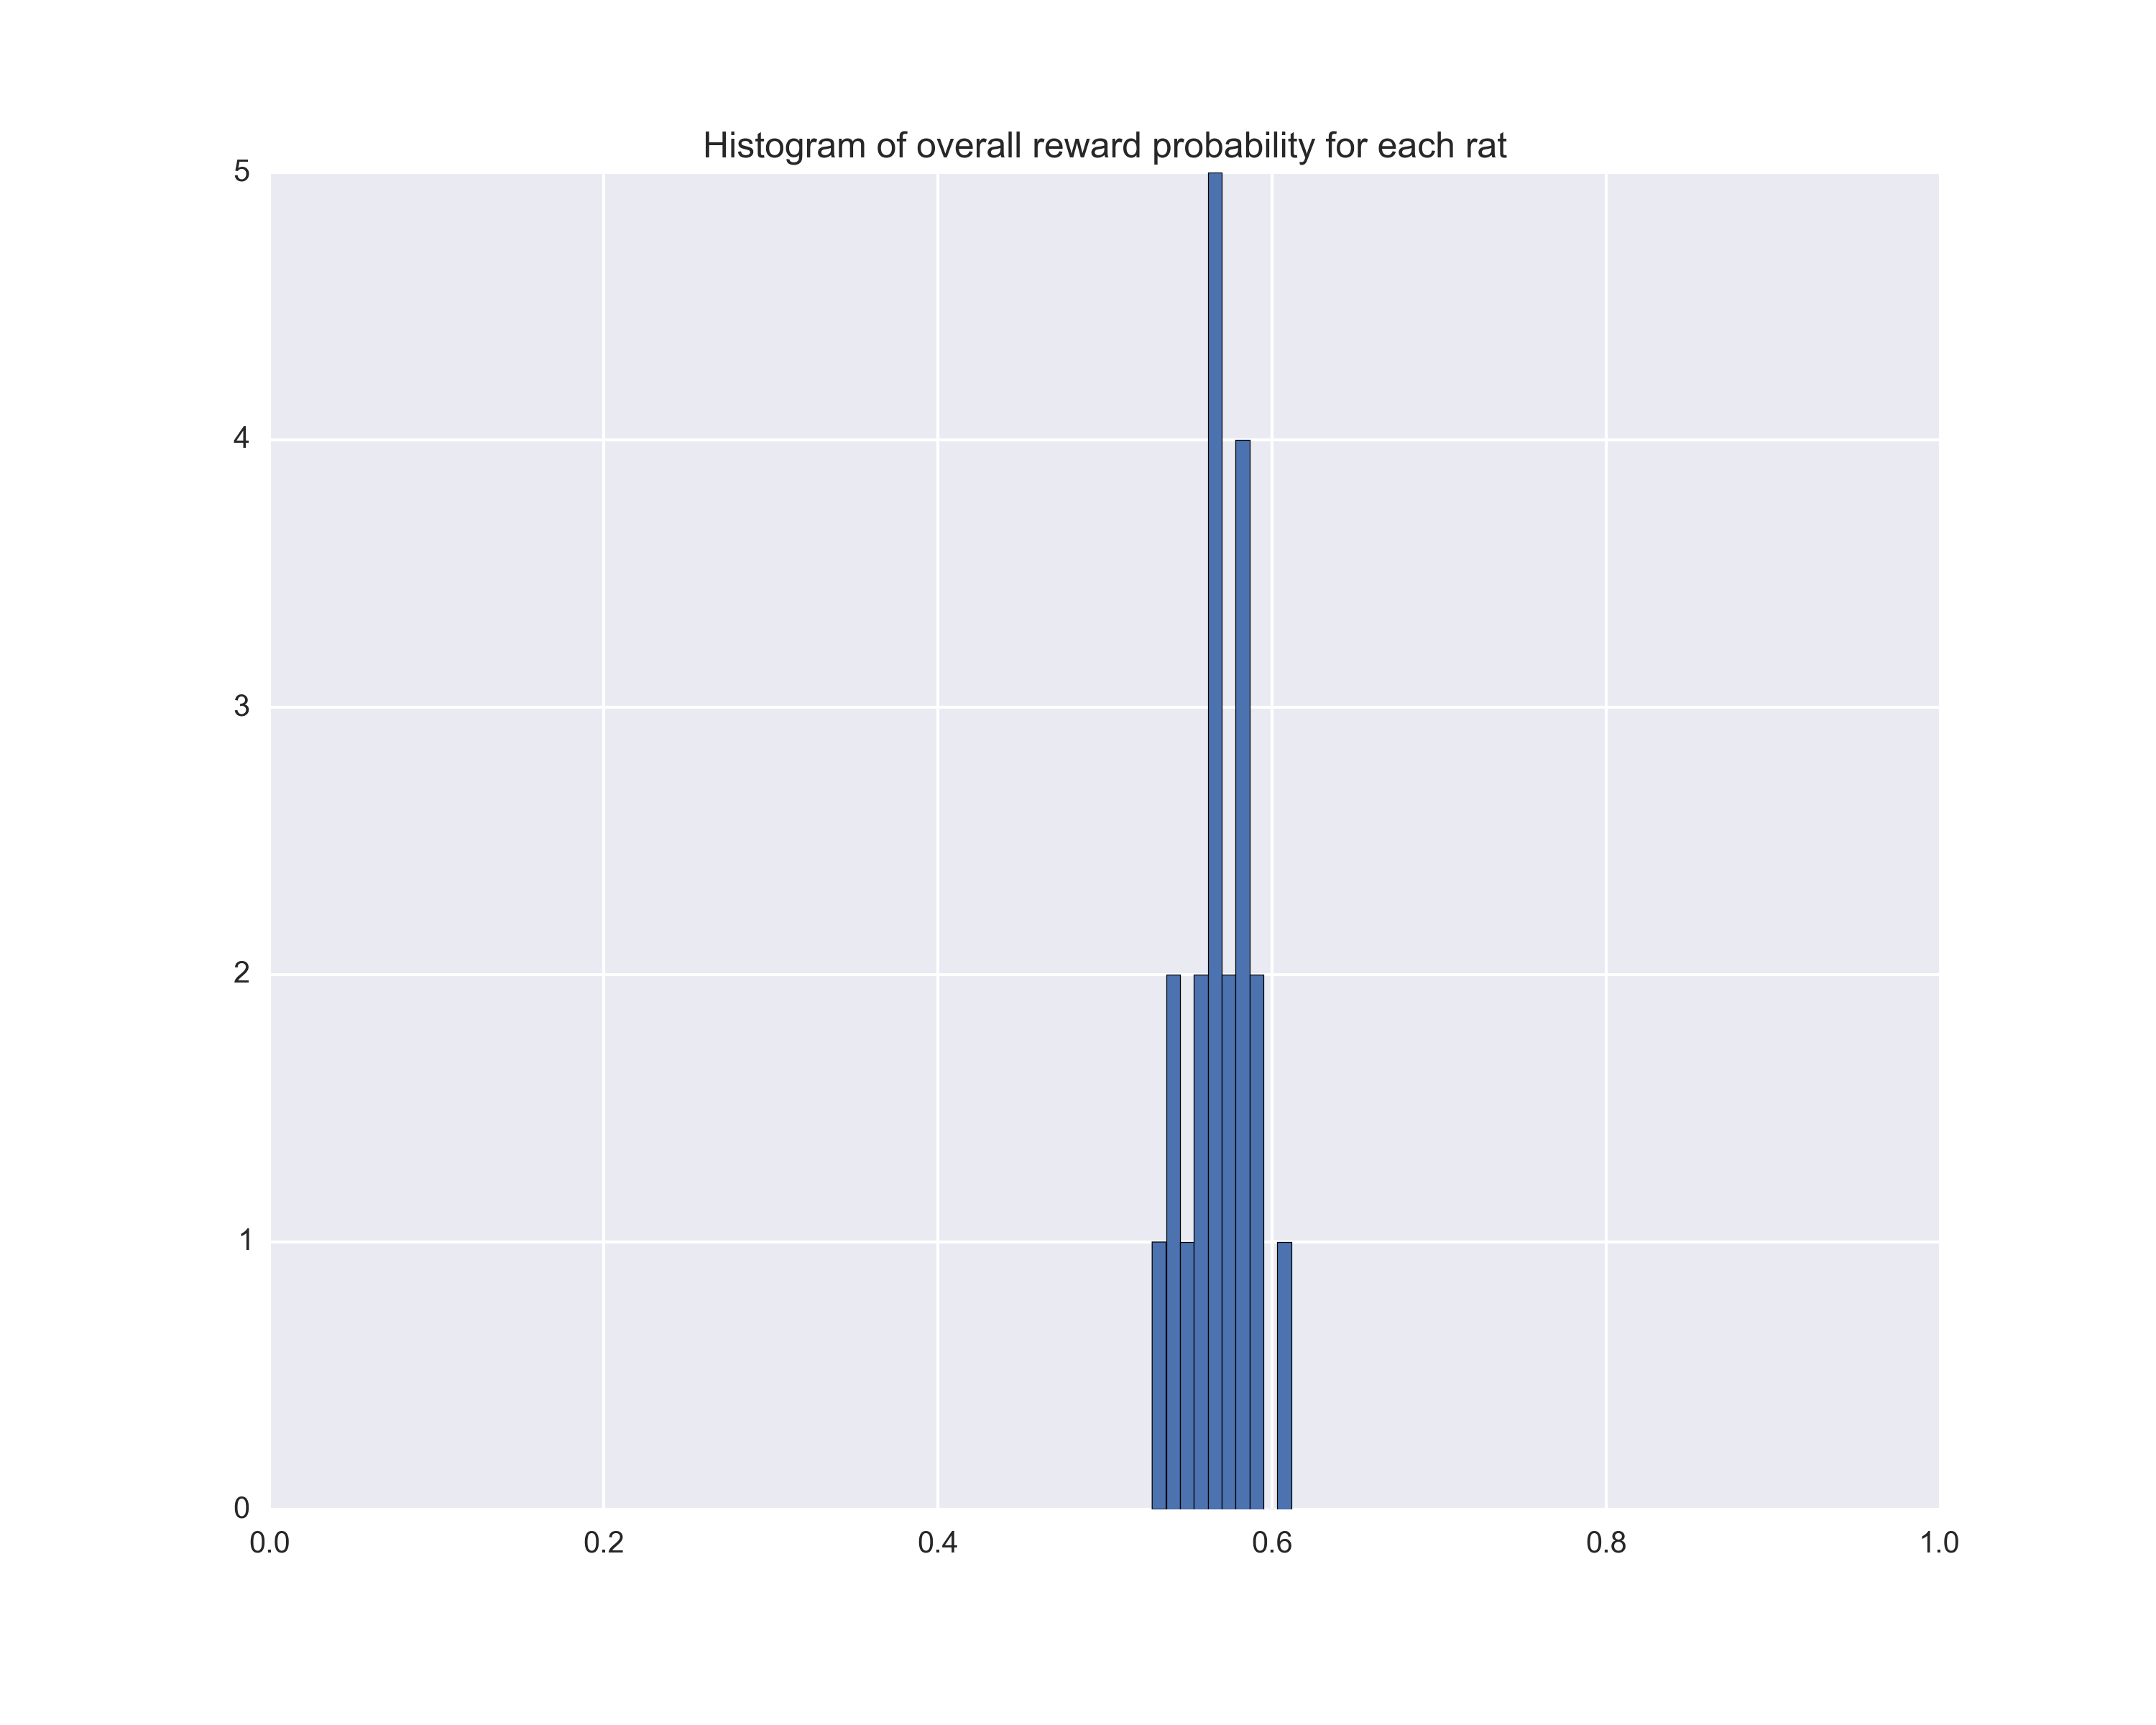
Is the overall reward probability similar between rats?
By reward probability, we don’t mean the latent reward probability that the experimental system uses. Rather, we mean the observed reward incidence, i.e. the proportion of trials when each rat actually receives a reward.
The histogram below suggests that rats receive similar amounts of rewards:
Reverse engineering the experimental system (1): how are trials fed?
How is the next trial type determined? Per the transition probabilities computed below, it seems to be chosen at random at each step, with 90% probability of a free-choice trial, 5% probability of a forced-left, and 5% probability of a forced-right:
Average transition probabliities over all sessions:
[[ 0.88704614  0.05639817  0.0565557 ]
 [ 0.88556099  0.05649934  0.05793967]
 [ 0.88833638  0.05723813  0.05442549]]
+/-
[[ 0.08631192  0.04622885  0.046599  ]
 [ 0.14779596  0.10531393  0.09640627]
 [ 0.14263365  0.09678701  0.0930963 ]]
In those matrices, the row/column order is:
- Free choice
- Left only
- Right only
Reverse engineering the experimental system (2): how does reward probability modulate?
First, let’s look at the overall probability of getting a reward given the choice made:
- probability of reward when go left, over all time: 57.4%
- probability of reward when go right, over all time: 57.7%
- probability of reward when violate the forced constraint, over all time: 0.0%
Now, let us try to examine how the observed (not underlying) reward probability modulates with time. We do so by:
- binning by
N=30consecutive trials - counting the proportion of trials when the rat decided to go left in each bin that resulted in a reward – which is shown in blue
- counting the proportion of go-right trials that gave a reward – shown in red
- counting the proportion of all trials (except violations) where a reward was earned – shown in black.
Below are plots of those proportions in bins of 30 trials from 5 random sessions:
- Session 888 with length: 665 trials
- Session 424 with length: 854 trials
- Session 629 with length: 689 trials
- Session 1233 with length: 351 trials
- Session 1854 with length: 216 trials
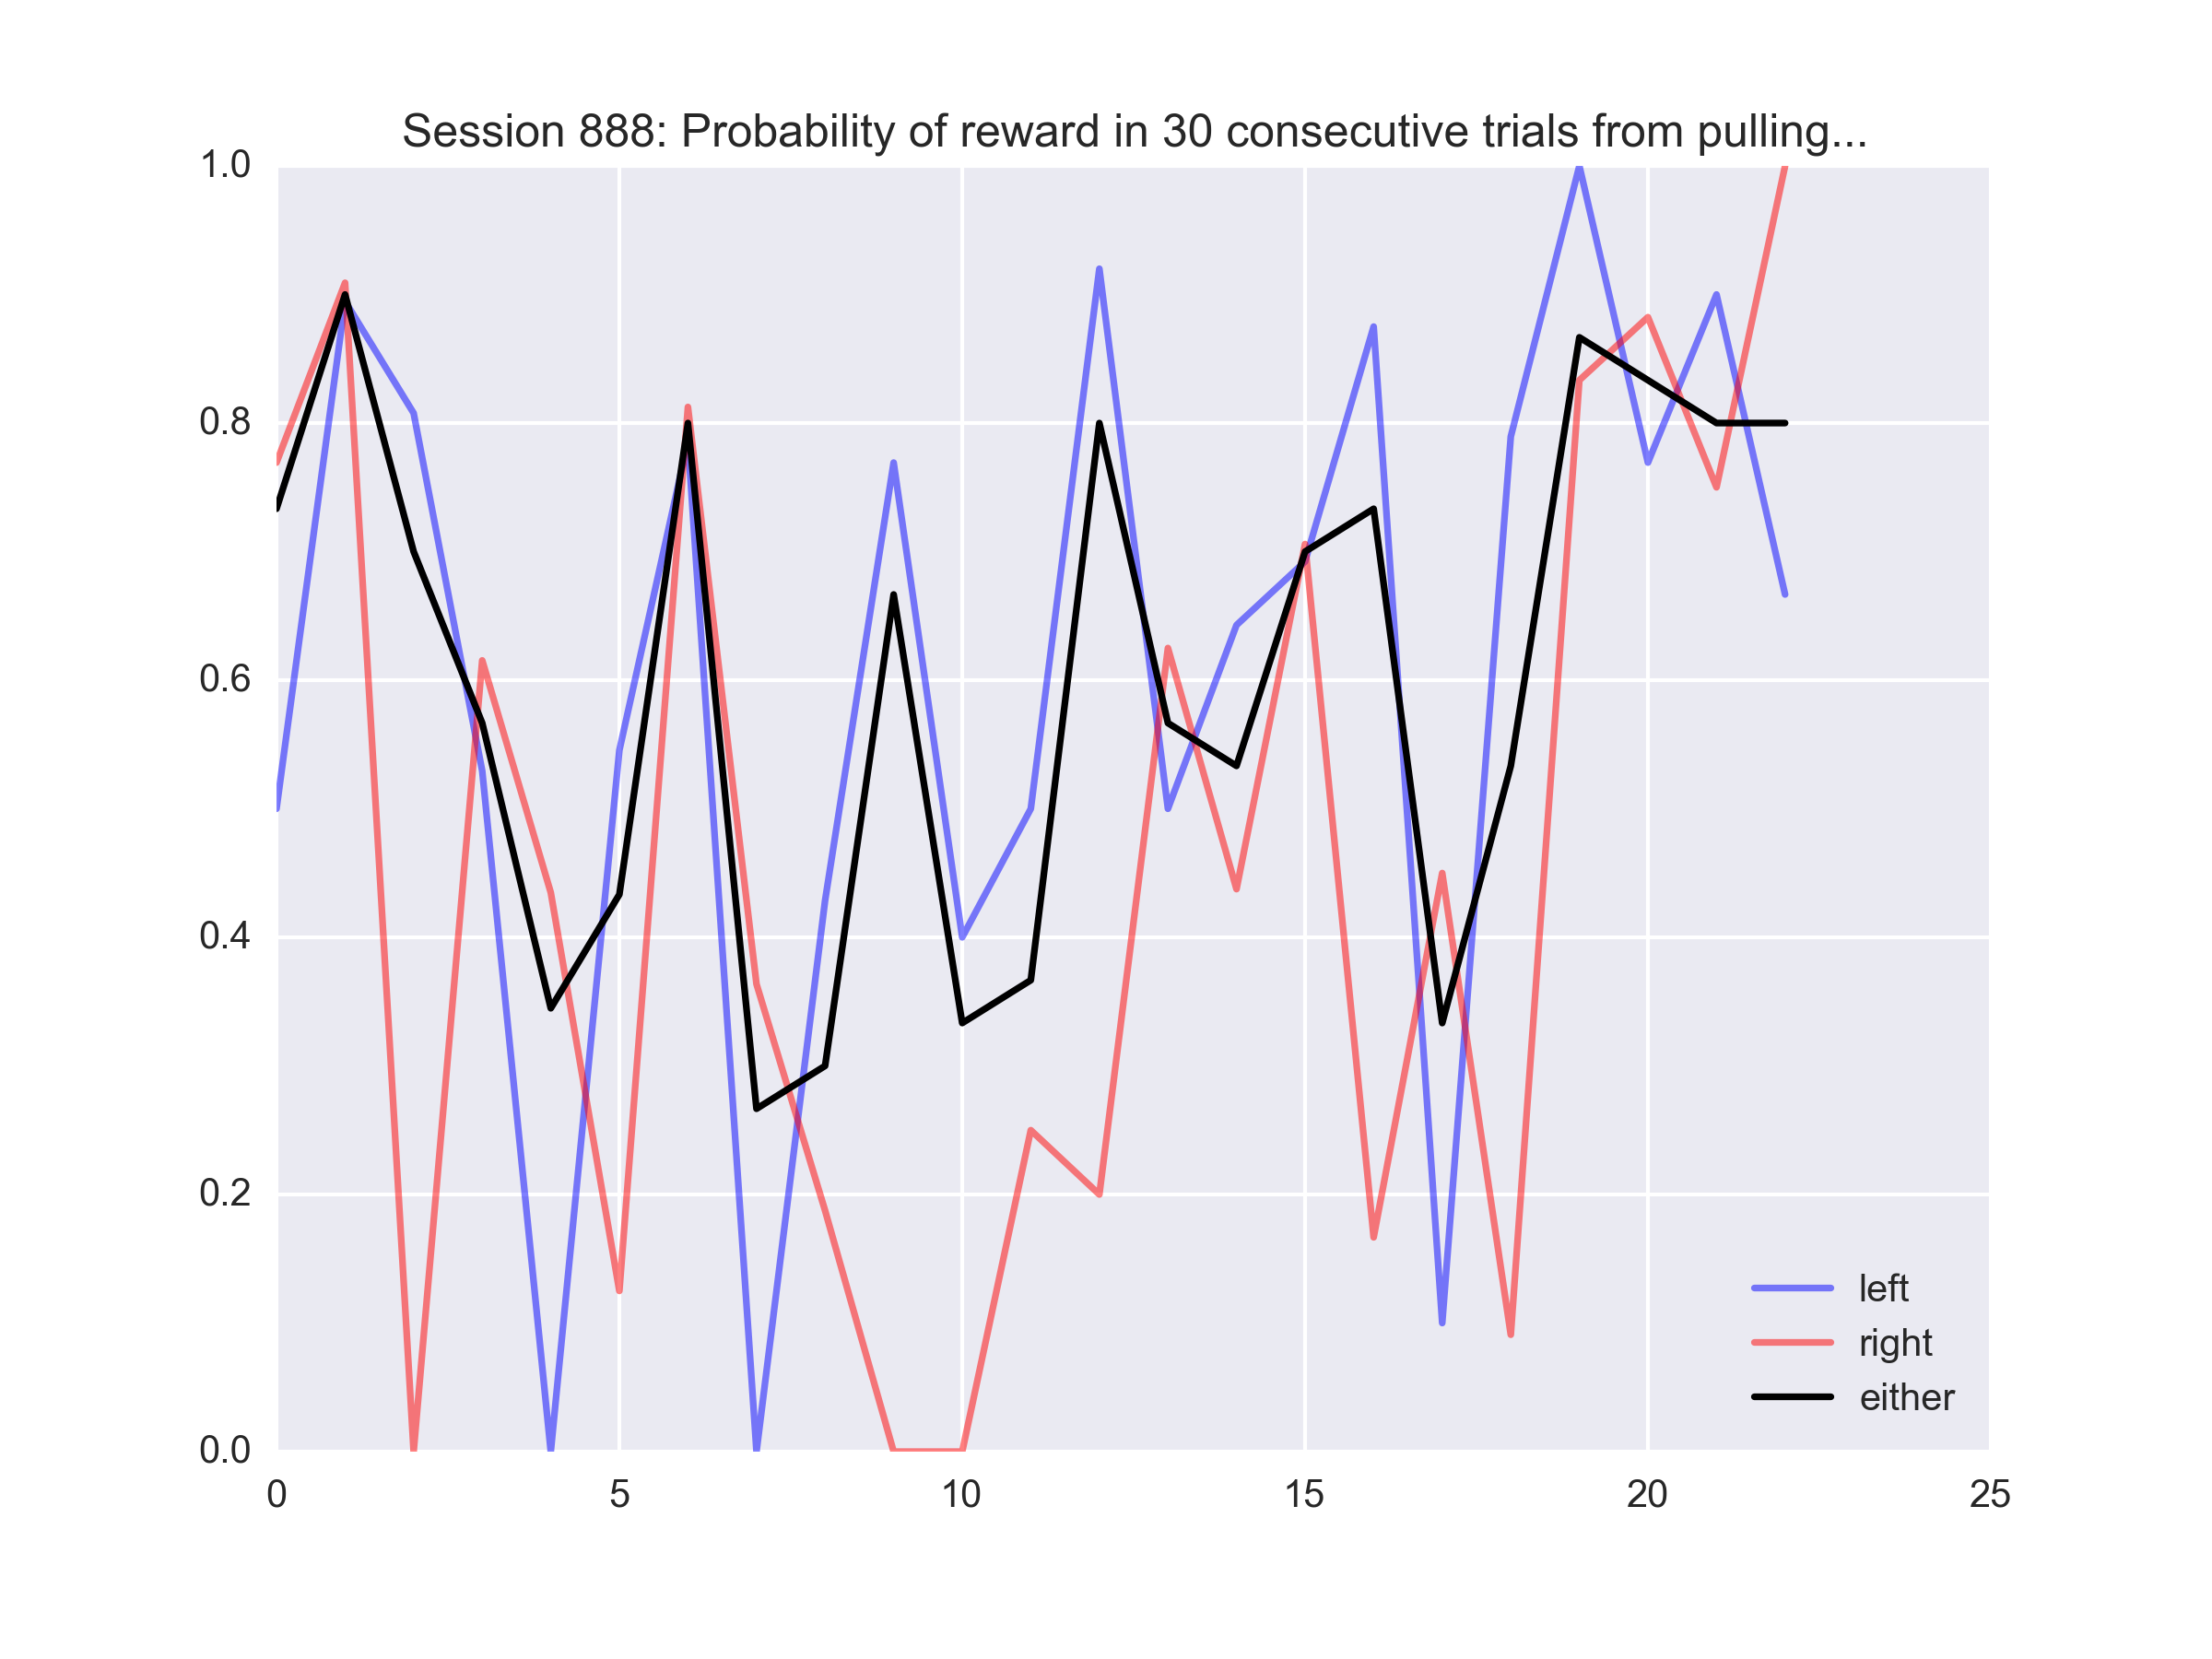
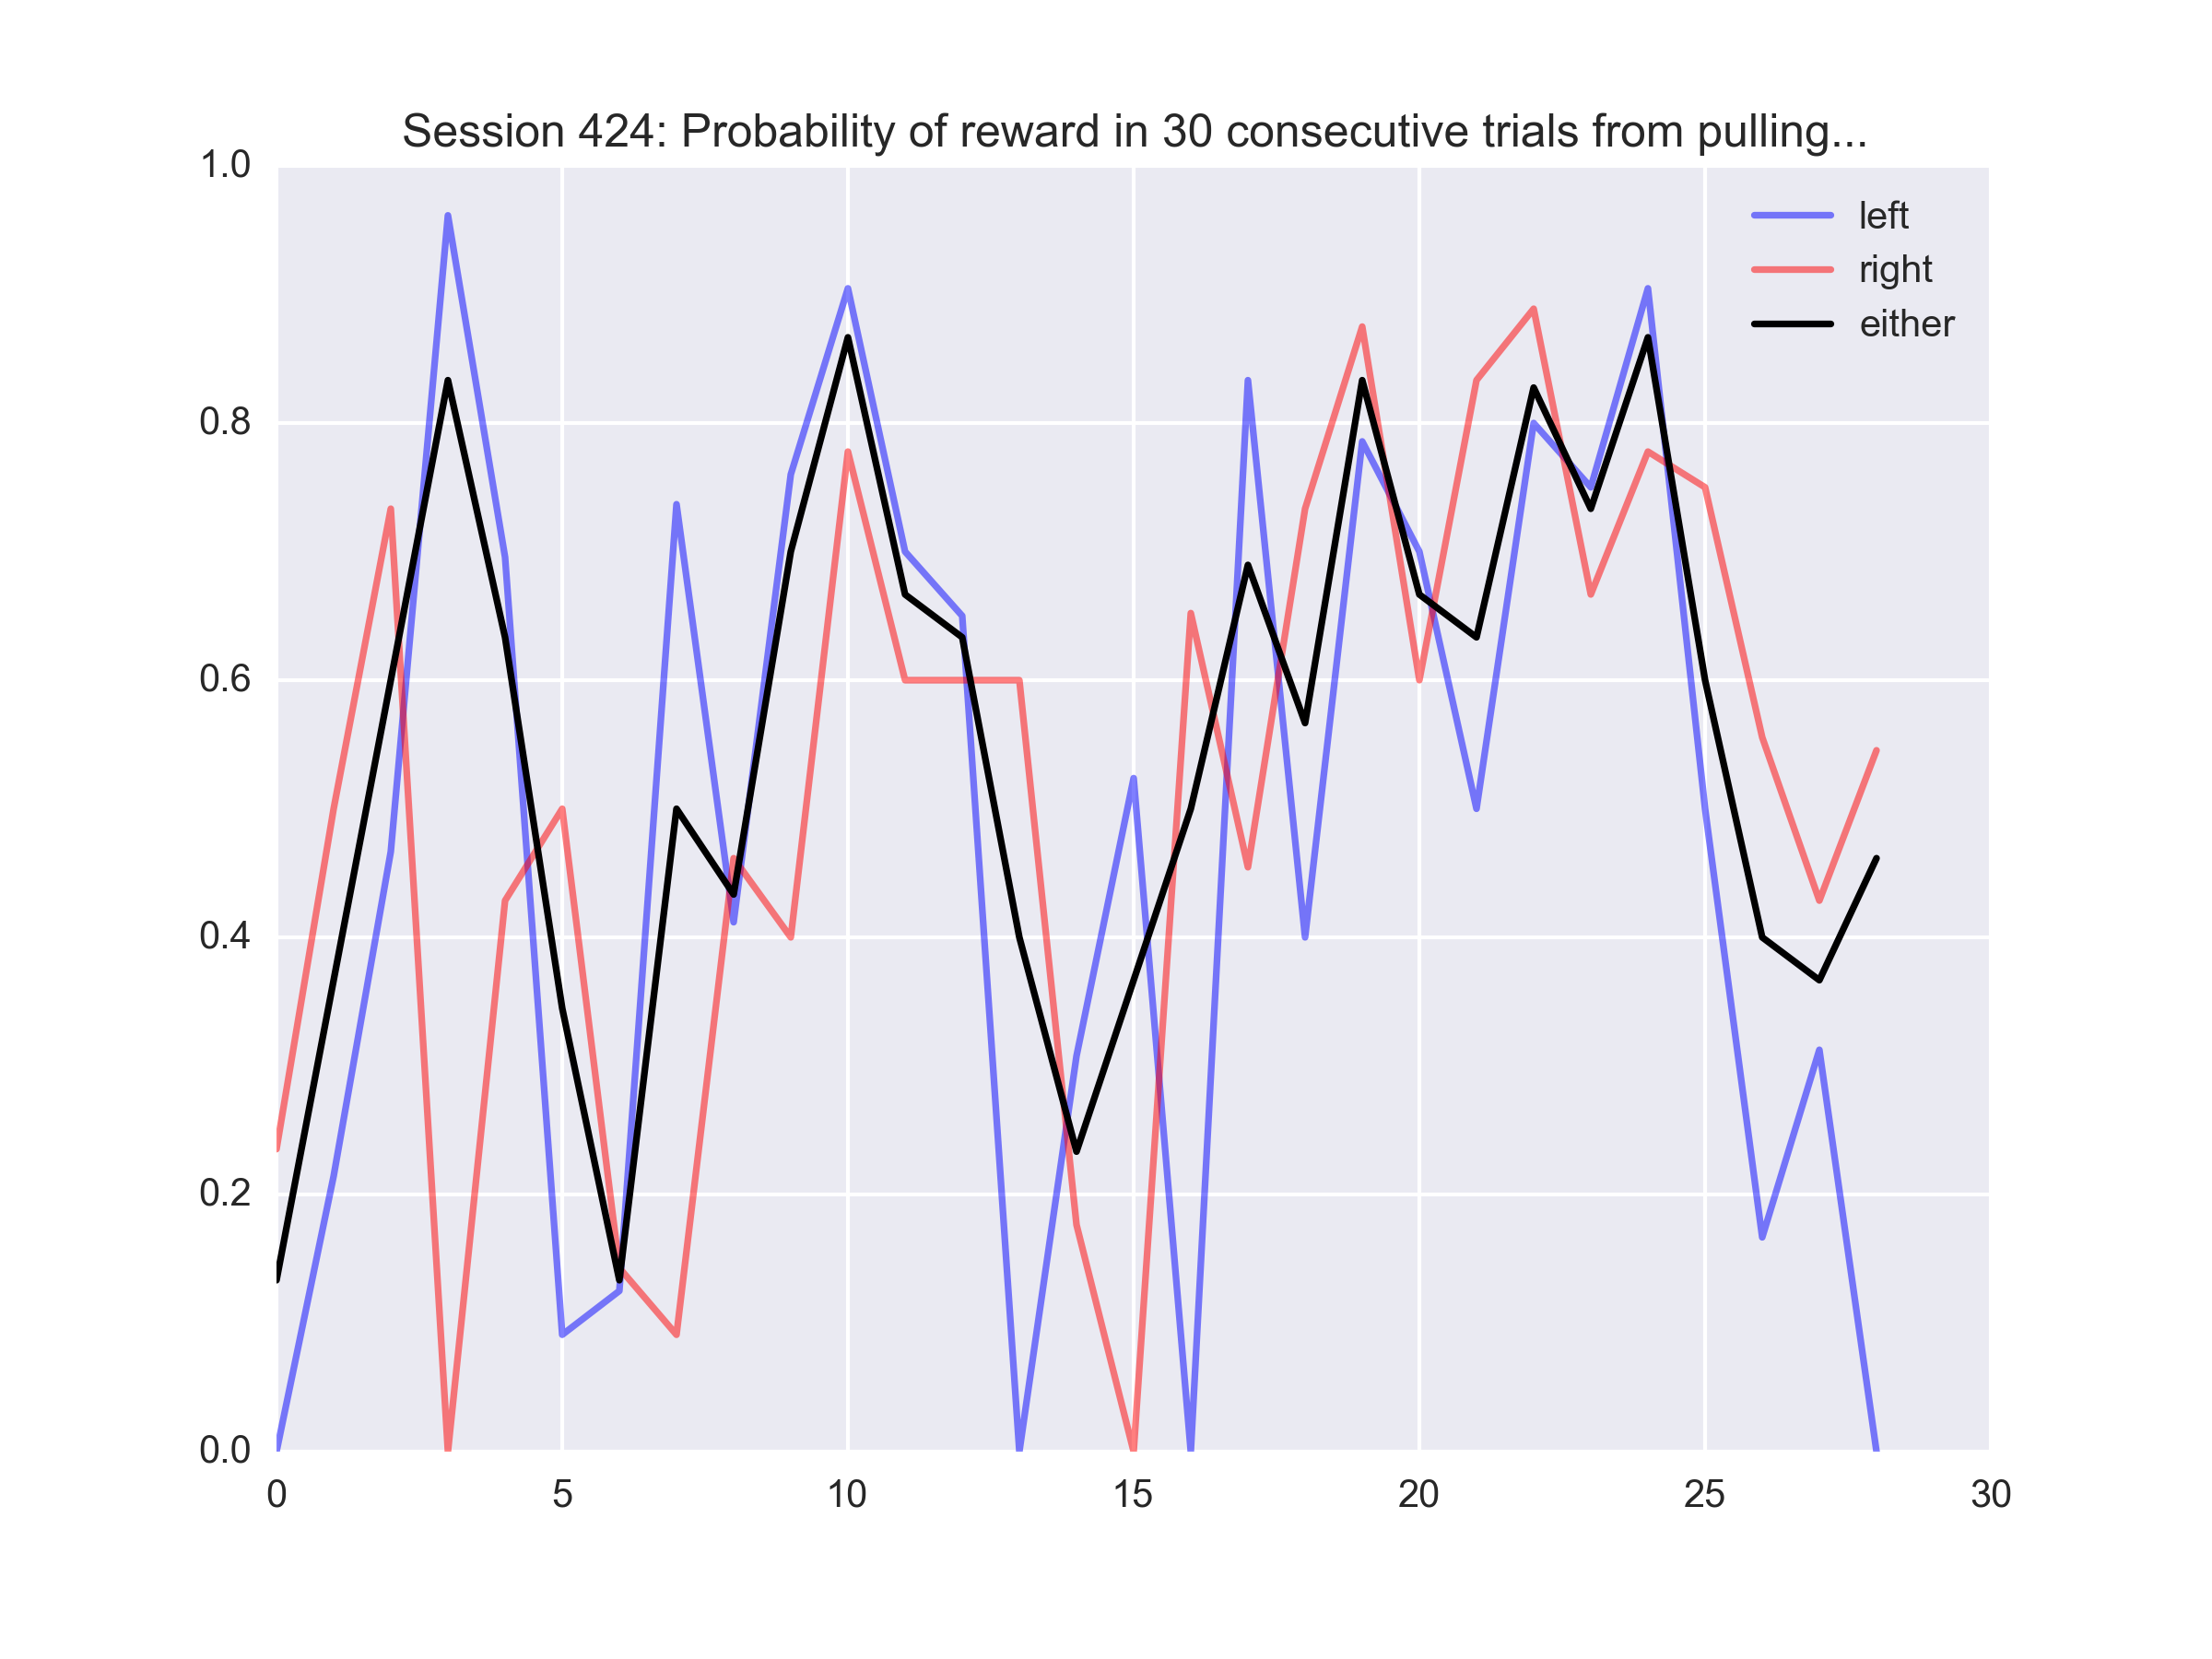
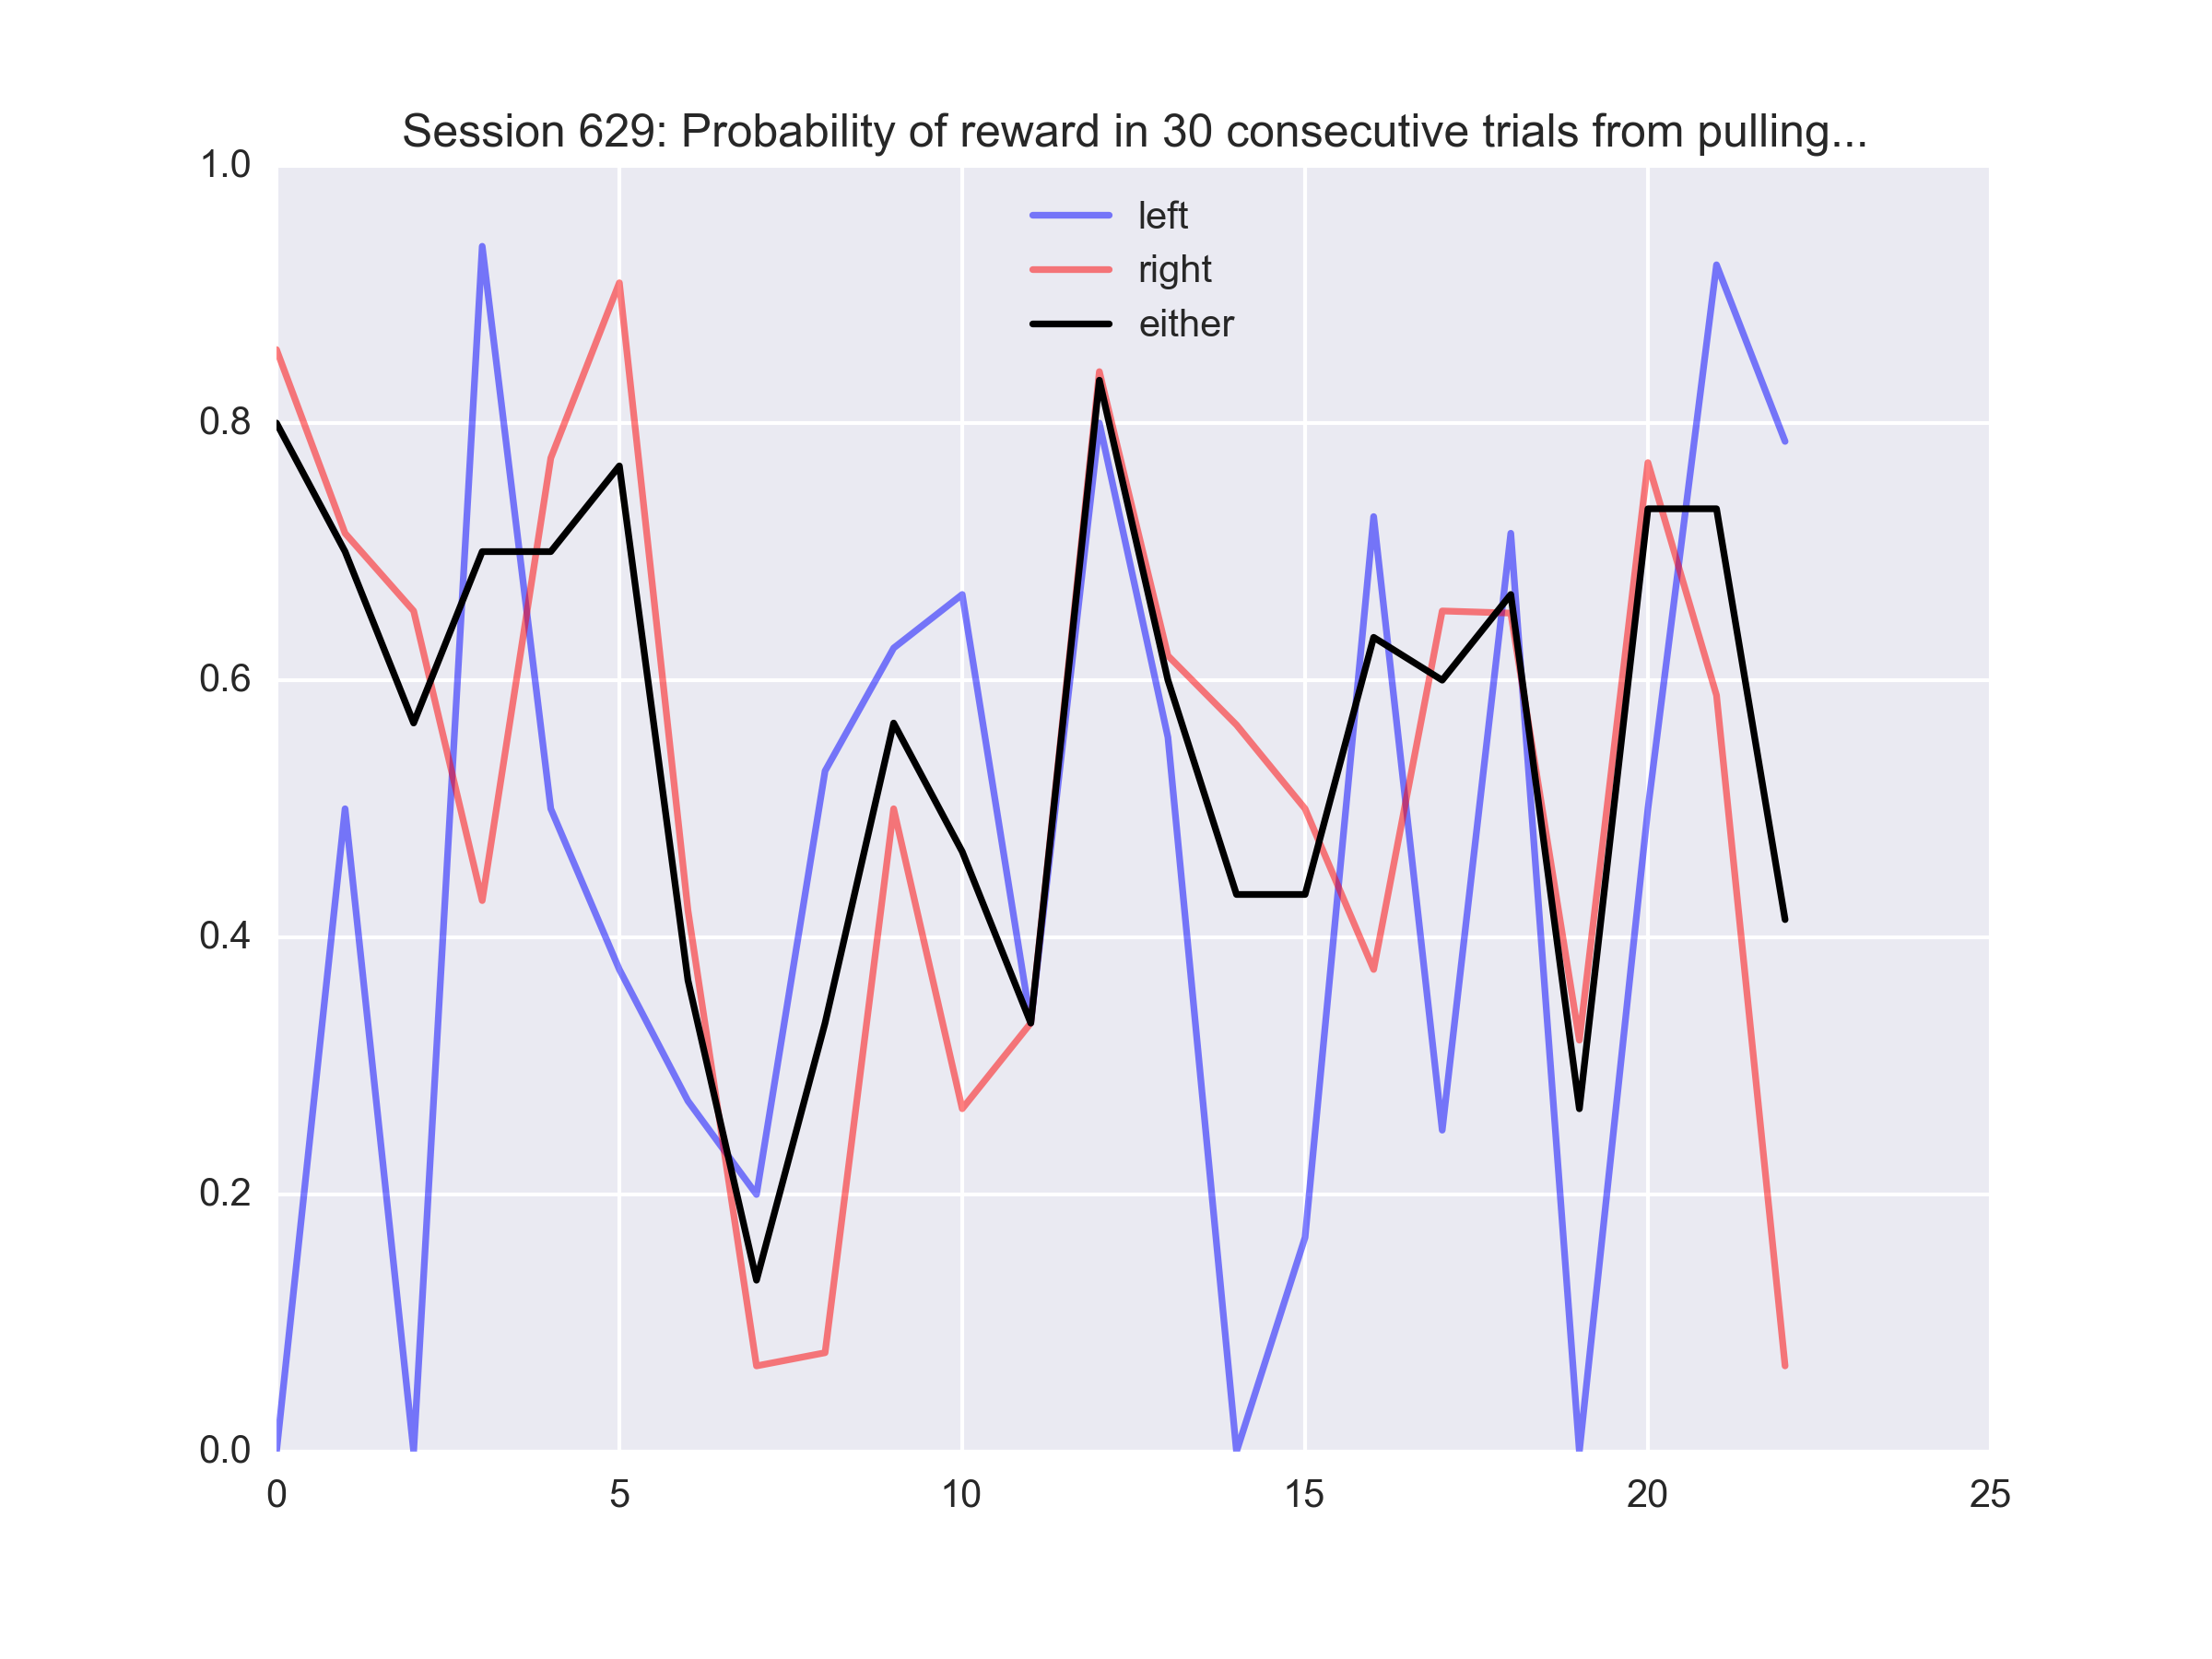
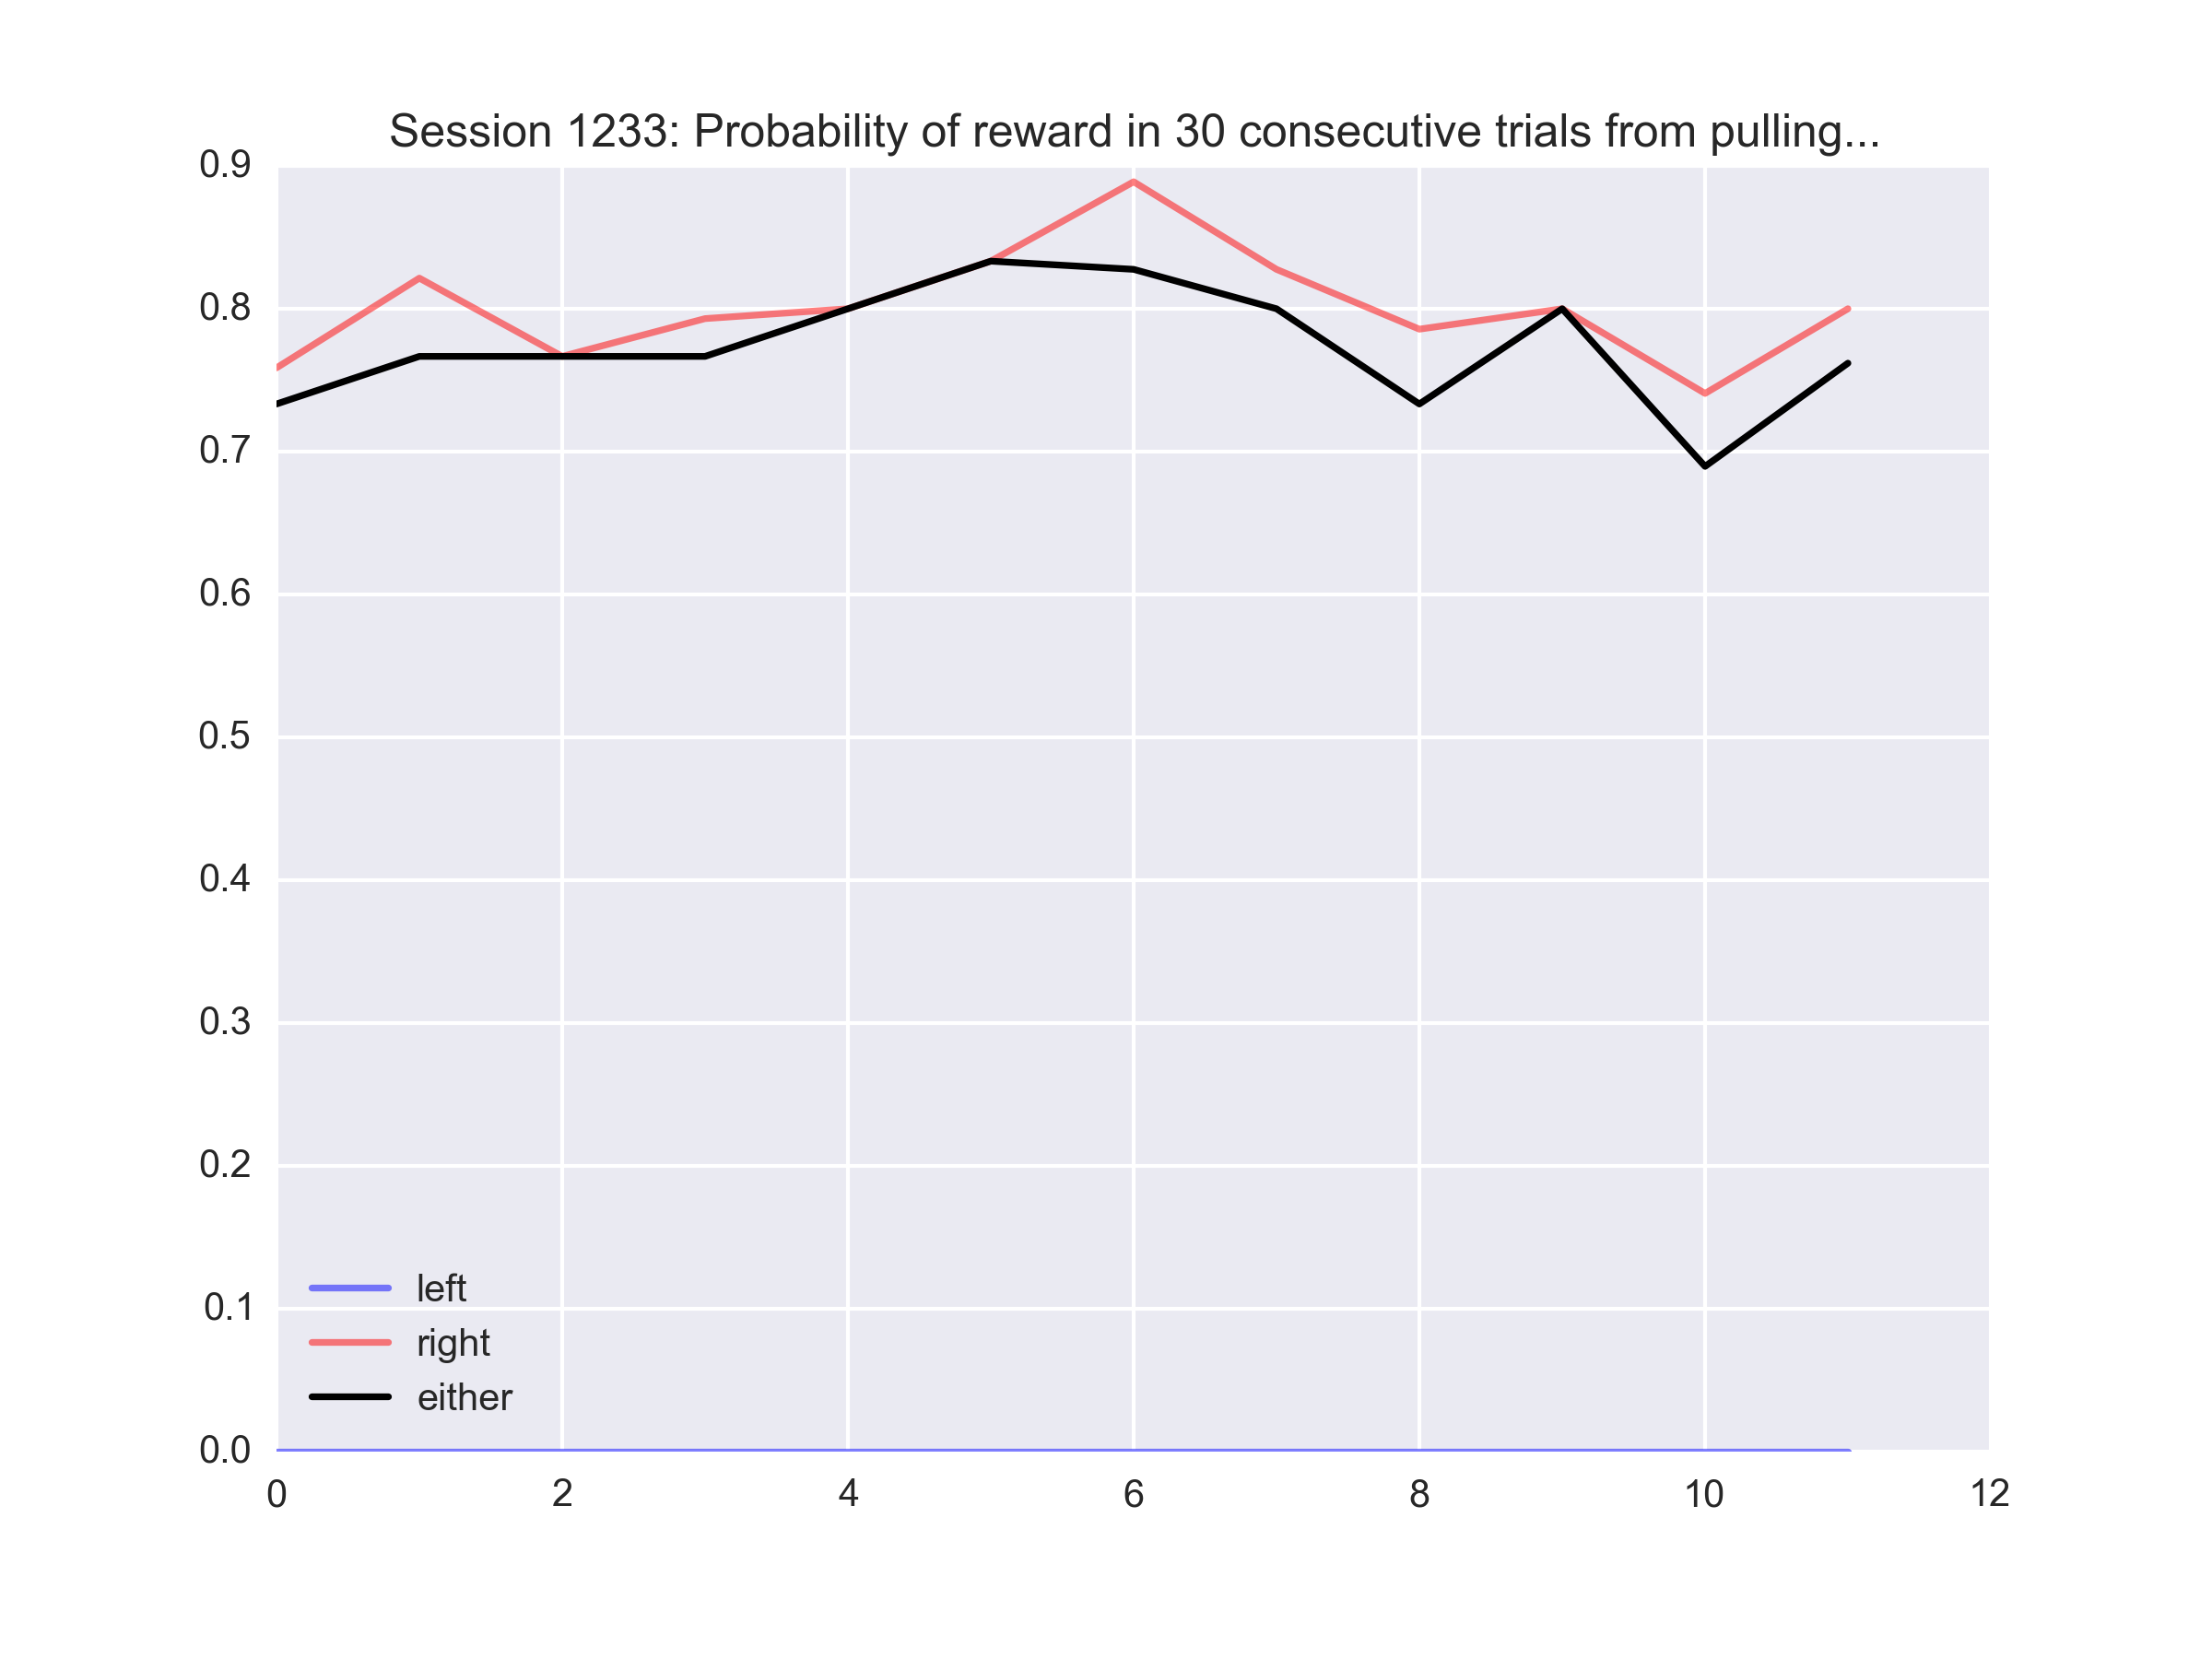
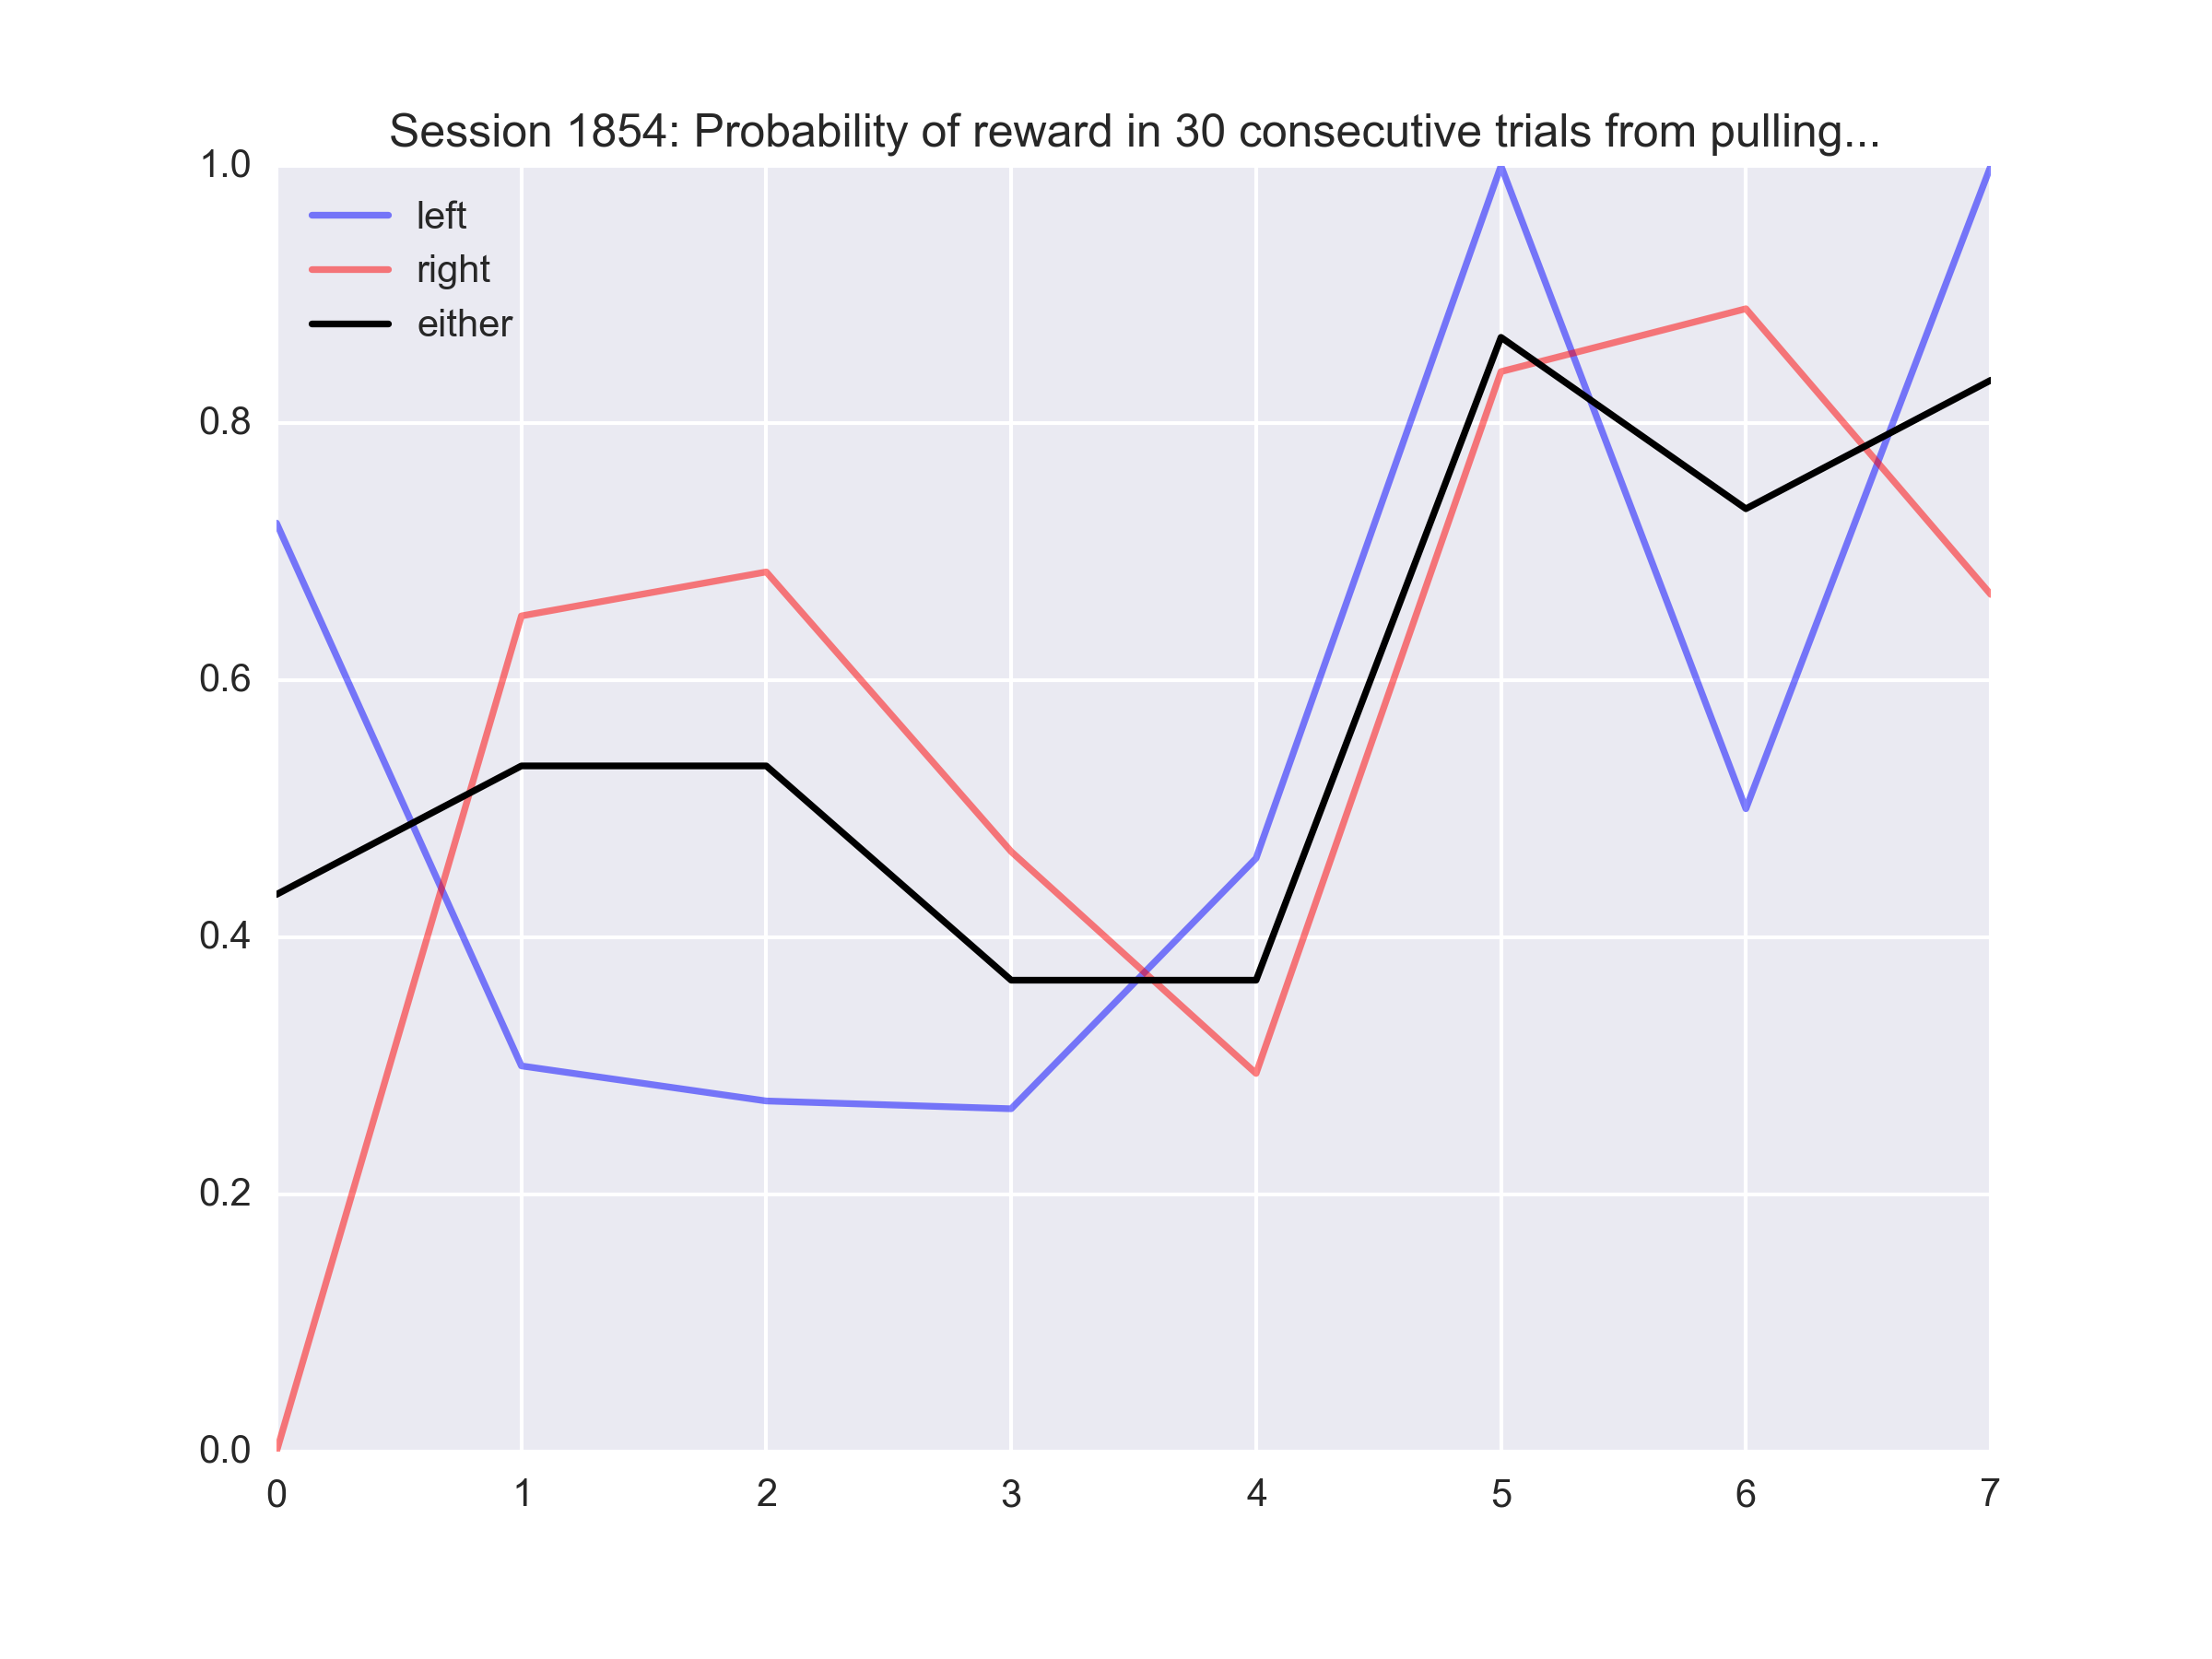
Notice that the observed reward probability modulates fairly randomly. It seems to fit what we have heard about experimental design: namely, that the reward probabilities are Brownian motion bounded in the interval [0, 1].
Also, notice how varied the sessions can be. For example, the fourth session shown (1233) has 0 reward probability from going left throughout! This deserves further digging: was the rat blind on the left side, perhaps?
Modeling as a Markov chain
How well can we model the rat’s actions as a Markov chain? Given the past 2 actions (L/R) and whether or not they were rewarded (0/1), what is the probability that the rat will go left on the next trial? Shown below are the graphs for 3 rats (42, 44, and 25). For simplicity, I threw out all the data that included forced trials.
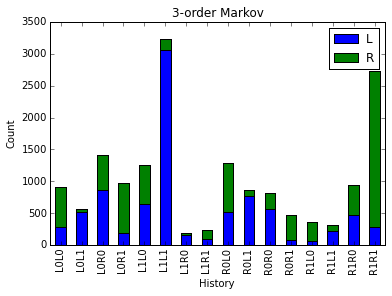
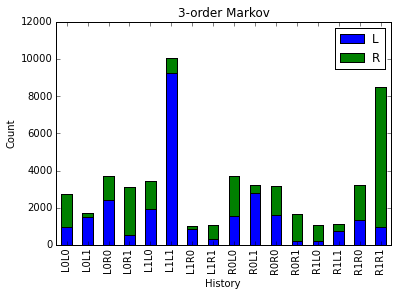
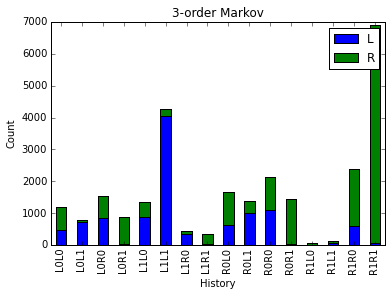
Here are tables showing the probability of going left given the previous 2 actions and rewards, for a number of rats.
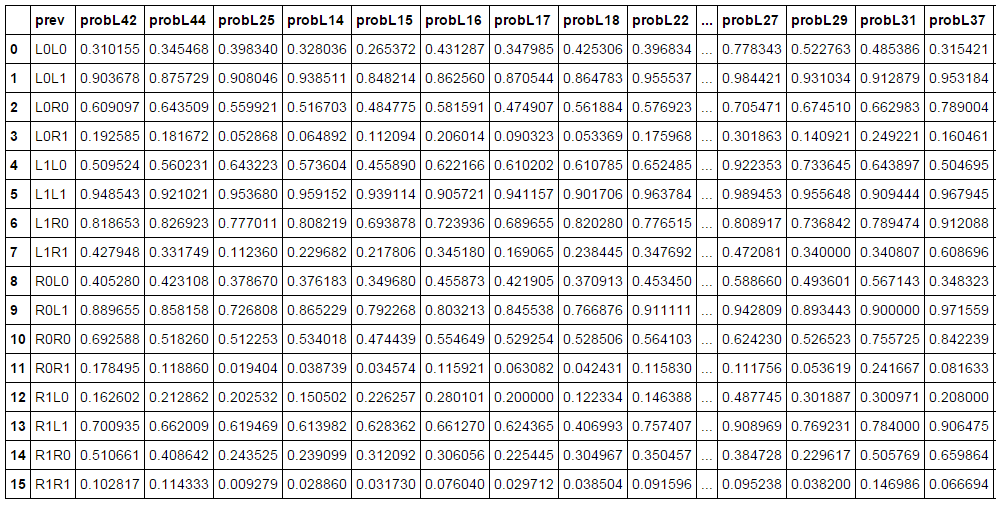
This confirms the intuition that if the rat chose a side and was rewarded/not rewarded on it, then it will more/less likely choose that side again. Overall the probabilities are similar between rats, but there is some variation that we can further investigate.